Camel TUI
Available as of Camel 4.21
Camel TUI is a terminal dashboard for developing, prototyping, and understanding Camel integrations. With over 40 screens organized across tabs, it makes your entire integration visible — you can browse your project source code with inline documentation, see your route topology, watch messages flow through processors, step through exchanges like scrubbing through a video timeline, inspect Kafka topics, run SQL queries against your DataSources, audit CVE vulnerabilities, and understand what Camel actually does with your routes. No more black box.
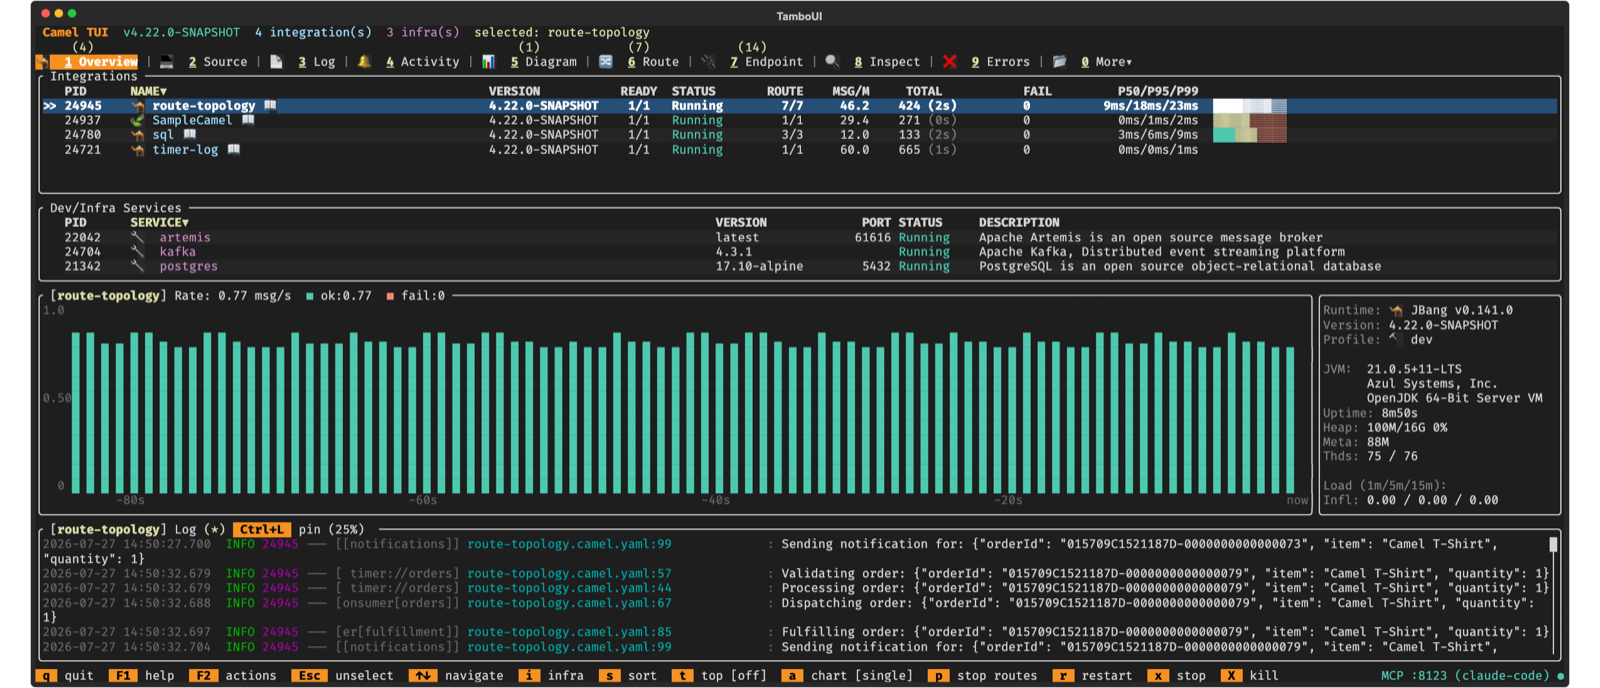
Getting Started
You can start using the TUI in two ways: with your own route, or by running one of the built-in examples.
Option 1: Your Own Route
Start a Camel integration in one terminal:
camel run my-route.yaml Open the TUI in another terminal:
camel tui The TUI auto-discovers every running Camel integration on your machine — no configuration needed.
Option 2: Built-in Examples
Don’t have a route yet? The TUI ships with a catalog of ready-to-run examples. Open the TUI and press F2, then select Run an example:
camel tui -
Press F2 to open the actions menu
-
Select Run an example…
-
Browse the example catalog — type to filter by name
-
Press Enter to launch the selected example
Before launching, a run options form lets you choose the runtime: Camel Main (standalone), Spring Boot, or Quarkus. This makes it easy to try any example on all three runtimes without changing a single line of code. You can also set the integration name, toggle dev mode, and add extra dependencies.
The example starts running in the background. The TUI auto-selects it as soon as it appears. From there you can explore tabs, watch messages flow, inspect the route diagram, and experiment.
If an example requires infrastructure (like Kafka or a database), the TUI automatically starts the required Docker containers before launching the example. A notification in the footer shows the progress.
The same runtime selector is available in Run from folder… (F2 menu), which lets you point the TUI at a local directory containing your routes. When a pom.xml is present, the runtime is auto-detected and locked to match your project.
| Press F1 or ? on any screen for context-sensitive help. Keyboard shortcuts are always shown in the footer bar. |
Option 3: Open a Project Directory
You can point the TUI directly at a project directory:
camel tui .
camel tui /path/to/my-project The TUI opens the directory in the Source tab so you can browse the project files immediately. When a pom.xml is present, the runtime is auto-detected (Spring Boot, Quarkus, or Camel Main). Press F10 to run the project — Maven projects are launched with the appropriate goal (spring-boot:run, quarkus:dev, or camel:run), and plain directories are run with camel run.
This is a quick way to explore and run any Camel project without starting it separately first.
Connecting Existing Spring Boot and Quarkus Applications
The TUI auto-discovers integrations started with camel run. To monitor and control existing Spring Boot or Quarkus applications, add the camel-cli-connector dependency to your project. This is a lightweight runtime adapter that lets the TUI (and the Camel CLI) communicate with your application — all TUI features work the same way regardless of runtime.
Spring Boot:
<dependency>
<groupId>org.apache.camel.springboot</groupId>
<artifactId>camel-cli-connector-starter</artifactId>
</dependency> Quarkus:
<dependency>
<groupId>org.apache.camel.quarkus</groupId>
<artifactId>camel-quarkus-cli-connector</artifactId>
</dependency> Once added, start your application normally and the TUI will discover it automatically. No additional configuration is needed — the connector auto-detects on the classpath and registers the application with the local Camel CLI.
See Managing Integrations for more details.
Tabs Overview
The TUI organizes information into tabs. Press number keys 1 through 0 to jump directly to any tab, or use Tab / Shift+Tab to cycle.
| Key | Tab | What It Shows |
|---|---|---|
1 | Overview | All running integrations and infrastructure services. Start here. |
2 | Source | File explorer for your project code with syntax highlighting and inline Camel documentation. |
3 | Log | Real-time application logs with search and filtering. |
4 | Activity | Live exchange activity with elapsed times, endpoint sends, and failure tracking. |
5 | Diagram | Visual route topology with drill-down into individual routes. |
6 | Routes | Route list with message counts, throughput, and processing times. |
7 | Endpoints | All registered endpoints with usage statistics. |
8 | Inspect | Message history and tracing — step through exchanges processor by processor. |
9 | Errors | Failures with stack traces and exchange context. |
0 | More | 30+ additional tabs organized by category (see below). |
The More menu (key 0) opens a popup with tabs organized into groups:
-
Routing — Browse Endpoints, Consumers, HTTP, Inflight, Producers, Route Controller
-
Observability — Circuit Breaker, Health, JFR, Metrics, Network Services, Exchange Events, Recovery Tasks, OpenTelemetry Spans
-
Data — JDBC DataSource, Kafka, SQL Query, SQL Trace
-
JVM — Classpath, Heap Memory Histogram, Memory Usage, Memory Leak, Process, Startup, Threads
-
Project — Beans, Catalog, Configuration, CVE Audit, Maven Dependencies, Type Converters, Data Type Transformers
Tabs appear dynamically based on what the integration uses. For example, the Kafka tab appears when a Kafka component is in use, SQL tabs when a DataSource is present, Circuit Breaker when resilience4j is in use, Spans when OpenTelemetry is enabled, and JFR when camel-jfr is on the classpath. The TUI adapts to show only what’s relevant to your integration.
Tab badges show live counts — the Errors tab shows a red badge when errors exist and Routes shows the route count.
Source Code Browser
The Source tab (Tab 2) gives you a file explorer into your project code. The left panel shows a navigable file tree of the integration’s source directory. Select any file to view it in the right panel with full syntax highlighting.
For Camel source files (YAML, XML, Java routes, and application.properties), press i to toggle inline documentation. The TUI uses the Camel catalog to look up every component, EIP, language, and data format used in your route and shows their documentation right next to the source code. For properties files, it resolves camel.component. and camel.main. keys to their catalog descriptions. This makes it easy to understand unfamiliar routes without leaving the terminal.
Additional features:
-
Format cycling — press Space to convert Camel routes between YAML, Java, and XML DSL formats
-
Search — press / to search within the source code, n/N to jump between matches
-
Highlight — press h to highlight text occurrences
-
Resizable panels — drag the split border with the mouse to resize the file list and viewer
Activity
The Activity tab shows a live feed of exchange activity — every exchange that flows through the system is captured with its route, status (OK or Failed), elapsed time, endpoint sends, and how long ago it completed.
Activity data is captured when the integration runs in development mode (the dev profile), which is the default when running with camel run. Activity tracking can also be explicitly enabled via camel.trace.activityEnabled=true in application.properties. On a production profile without dev mode or explicit enablement, the tab is empty.
The top panel shows aggregated statistics: total / OK / failed exchange counts, total sends, p50 / p95 / max elapsed times, and the time window of the visible entries.
Select an exchange to see its details below: exchange ID, route, elapsed time, the remote endpoints called during the exchange with individual timings, and exception details if the exchange failed.
Use s to cycle sort order, S to reverse, and F5 to clear the activity list.
Route Topology Diagram
The Diagram tab renders the route topology as interactive ASCII art. It shows how routes connect to each other through shared endpoints (direct, seda, kafka, etc.).
Topology View
The topology shows all routes as boxes, connected by arrows:
-
Trigger routes (timer, cron, etc.) appear at the top
-
Downstream routes appear below, connected by directed arrows
-
Route boxes show the route ID, the
fromendpoint, and metrics when enabled
Navigate between route boxes with arrow keys. When a route is selected, an Info panel appears on the left showing state, uptime, throughput, exchange counts, and processing times.
Drill-Down into Routes
Press Enter on a selected route to drill down into its internal EIP structure. Each processor and EIP node is displayed with its type (colored by category), endpoint URI, and per-node statistics.
Nodes that connect to other routes show a Enter indicator — press Enter to jump directly to the linked route. Navigation history is maintained as a breadcrumb stack: press Esc to go back to the previous route, and eventually back to the topology view.
Press t to jump straight back to the topology from any depth.
Message Insight
The Inspect tab lets you step through an exchange processor by processor — like scrubbing through a video timeline of your message’s journey. This is the key to understanding what Camel does with your data at every step.
History of Last Exchange
When you open the Inspect tab, it shows the last completed exchange. The top panel lists every processing step with:
-
Step number and direction (-→ or ←-)
-
Route and Node ID of the processor
-
BHPV change indicators — letters light up in yellow when Body, Headers, Properties, or Variables changed at that step
-
Elapsed time per step
Select a step with arrow keys, and the detail panel below shows the full exchange state: body content, headers, properties, and variables at that exact point in the processing chain.
Controlling What You See
Toggle sections of the detail view:
-
b — show/hide message body
-
h — show/hide headers
-
p — show/hide exchange properties
-
v — show/hide exchange variables
-
w — toggle word wrap
-
n — toggle description/processor labels
Waterfall View
Press g to switch to the waterfall view — a horizontal bar chart showing how long each processor took. This makes it easy to spot bottlenecks: long bars stand out immediately. The selected step is highlighted with >> and processing times are color-coded from green (fast) to red (slow).
Replay on the Diagram
Press d to overlay the message path on the route topology diagram. This is where the timeline replay comes alive:
-
The diagram highlights which route and processor handled the message at each step
-
Use Up/Down arrows to step forward and backward through the path
-
An Info panel on the left shows the exchange state (body, headers, properties, variables) at the current step — values that changed from the previous step are highlighted in yellow
-
Step through the entire exchange to watch how the message payload transforms as it flows through processors, filters, and content-based routers
-
Press Enter on a route node to drill down into its internal EIP structure while replaying
-
Press Esc to go back, t to return to the topology view
-
Press i to cycle the info panel size (narrow / wide / full)
This is especially powerful for understanding complex multi-route flows where messages are routed through direct, seda, or kafka endpoints between routes.
Live Tracing
When you run your integration with tracing enabled:
camel run my-route.yaml --trace The Inspect tab gains a live trace panel showing every exchange as it flows through the system. Each exchange is listed with its timestamp, starting route, status (Processing/Done/Failed), elapsed time, and step count. Press Enter to drill into an exchange and see every processor step — the same step-by-step view and diagram replay work here too.
Use s to cycle sort order (time, route, elapsed, exchange) and S to reverse. Press F5 to clear captured traces.
Troubleshooting Errors
The Errors tab collects failures with full stack traces and exchange context. When errors occur, a red badge appears on the tab.
For deeper troubleshooting, switch to the Inspect tab and use the diagram replay (press d) to visualize exactly where the failure occurred:
-
Failed steps are highlighted in red on the diagram
-
Step through the failing exchange to see the message state at each processor leading up to the failure
-
The Info panel shows the exception message and which node threw it
-
Compare the message body and headers before and after the failing step to understand what triggered the error
This combination of error details + visual diagram replay gives you a complete picture of what went wrong and why — without leaving the terminal.
OpenTelemetry Spans
The Spans tab (under More, shortcut o) visualizes OpenTelemetry traces collected from your running integration. It shows every span with trace ID, span name, kind, status, duration, and Camel-specific context (route ID, processor ID).
Run your integration with OpenTelemetry enabled:
camel run my-route.yaml --dep=camel:opentelemetry Features:
-
Waterfall view — spans displayed as a timeline showing parent-child relationships and duration bars, color-coded from green (fast) to red (slow)
-
Trace grouping — spans grouped by trace ID so you can follow a complete request across multiple routes and components
-
Camel-only filter — toggle to show only Camel-originated spans, hiding framework and library spans
-
Sort and search — sort by trace ID, route, status, duration, or span count; filter with text search
-
Error highlighting — failed spans (status ERROR) are highlighted in red
This is especially useful for understanding latency in multi-route integrations and for correlating Camel processing with external service calls (HTTP, database, messaging).
Process Information
The Process tab (under More, shortcut p) shows JVM process details for the selected integration: Java version, PID, uptime, command-line arguments, and system properties.
HTTP Probe
The HTTP tab (under More > Routing > HTTP) lists all HTTP/REST endpoints in your integration. Press Enter on any endpoint to open the built-in HTTP probe — a lightweight Postman for testing your REST services directly from the terminal.
Probe Layout
The probe screen is split into a request panel (left) and response panel (right):
Request panel — top to bottom:
-
Method — HTTP verb cycler (
GET,POST,PUT,DELETE,PATCH,HEAD,OPTIONS). Use Left / Right arrows to cycle. -
Path — editable path field, pre-filled from the endpoint. Supports
{xxx}placeholders. -
Path Parameters — if the path contains
{id},{name}, etc., a fill-in field appears for each placeholder. Values are substituted into the URL when sending. -
Query Parameters — key-value pairs appended to the URL as
?key=value&key2=value2. Press + to add a parameter. -
Content-Type — cycler with common MIME types (
application/json,application/xml,text/plain, etc.). Pre-filled from endpoint metadata when available. -
Accept — cycler for the Accept header. Pre-filled from endpoint metadata.
-
Headers — custom request headers as key-value pairs. Press + to add a header.
-
Body — multi-line text area (6 rows) for request body. Supports JSON, XML, plain text, or
file:payload.jsonto load from a file. Press Enter to insert newlines. -
History — previously sent requests with status codes and elapsed times. Press Enter to replay a request, restoring all fields.
Response panel — shows the response body with status code, elapsed time, and response headers. Press p to toggle pretty-printing for JSON and XML responses.
The resolved URL is shown at the top of the request panel as a clickable hyperlink that you can copy for use with curl or other tools.
Sending Requests
Press F5 to send the request (same pattern as the SQL tab). The response appears in the right panel. While sending, the status shows a spinner.
Keyboard Shortcuts (Probe)
| Key | Action |
|---|---|
F5 | Send request |
Enter | Insert newline (body) or advance to next field |
Tab / Shift+Tab | Next / previous field |
Left / Right | Cycle method, Content-Type, or Accept values |
+ | Add query parameter or header |
Backspace | Remove empty query parameter or header |
p | Toggle pretty-print response |
Esc | Exit probe mode |
Actions Menu (F2)
Press F2 to open the actions menu with quick access to common operations:
| Action | Description |
|---|---|
Send Message | Send a test message to any route with custom body, headers, and exchange pattern. |
Run an example… | Browse and launch built-in Camel examples from the catalog. |
Run from folder… | Run routes from a local directory. |
Run Dev/Infra Service… | Start infrastructure services (Kafka, databases, etc.) in Docker. |
Browse Files… | Browse the integration’s source files with syntax highlighting. |
Run Doctor | Check your environment: Java version, JBang, Maven, Docker, port conflicts, disk space. |
Reset Stats | Reset all statistics and metrics for the selected integration. |
Stop All | Stop running integrations and/or infrastructure services. |
Settings… | Change the theme, the starting tab, and the default run-from-folder. |
Take Screenshot | Export the current screen as SVG, text, or ANSI art. |
Start/Stop Tape Recording | Record your session as a |
Sending Test Messages
Select Send Message from the F2 menu (or press F2 then choose it):
-
Choose the route — use left/right arrows to pick the target route
-
Enter the body — type the message body, or use
file:path/to/fileto load from a file -
Add headers — press + to add headers as key=value pairs
-
Set exchange pattern — toggle between InOnly (fire-and-forget) and InOut (request/reply)
-
Press Enter to send
For InOut exchanges, the response is displayed below with status, elapsed time, response headers, and body. Press P to toggle pretty-printing for JSON/XML responses.
Theme
The TUI ships with 15 color themes defined as CSS stylesheets:
-
Dark themes — Dark (default), Dracula, Nord, Solarized Dark, Gruvbox Dark, Catppuccin Mocha, Tokyo Night, Rosé Pine, Kanagawa, Everforest, Monochrome, CRT
-
Light themes — Light, Solarized Light, Catppuccin Latte
Open the F2 actions menu and choose Settings… to switch themes, or pass --theme=<name> on the command line (e.g., --theme=tokyo-night). The CLI value overrides the persisted preference from .camel-cli.properties; runtime toggles and the config file still apply on later launches when --theme is omitted.
The brand orange accent is consistent across all themes; status colors (success, warning, error) and borders adapt for readability on each palette.
Your choice is remembered: it is saved as camel.tui.theme in .camel-cli.properties and restored the next time you open the TUI.
Settings
Open the F2 actions menu and choose Settings… to change TUI preferences in one place:
-
Theme — cycle through 15 available themes (applied immediately on save).
-
Starting Tab — the tab shown when the TUI launches; any tab (primary or under More) can be chosen. Defaults to Overview.
-
Select Tab — the tab to switch to when selecting an integration from the Overview tab. Defaults to Log.
-
Confirm — whether destructive actions (quit, stop, restart, stop/start routes) show a confirmation dialog before executing. Defaults to on. Kill (X) always confirms regardless of this setting.
-
Default Folder — the folder pre-filled in Run from Folder. The most recently used folder still takes precedence; this default is used only when there is no remembered folder.
Use ↑/↓ to move between rows, Space (or ←/→) to cycle the theme and tab settings, type to edit the default folder, Enter to save, and Esc to cancel.
Settings are stored under camel.tui.* keys (camel.tui.theme, camel.tui.startTab, camel.tui.selectTab, camel.tui.confirmActions, camel.tui.defaultFolder, camel.tui.shell.history, camel.tui.ai.promptHistory) in the Camel CLI configuration file. Each key is read from and written back to the file where it currently lives: a key present in the local ./camel-cli.properties is treated as a project-level override and stays local, while every other key defaults to the global ~/.camel-cli.properties. This means a project can deliberately pin a starting tab in its local config without redirecting your personal theme into the project file. See Configuration for details on the global and local files.
Input history
The embedded shell (F6) and AI prompt (F8) keep a recall list for the command line and prompt respectively. Use ↑/↓ on the input line to walk previous entries. Limits are configured with camel.tui.shell.history and camel.tui.ai.promptHistory in .camel-cli.properties (default 100 each; set to 0 to disable recall and persistence). Shell history is stored in ~/.camel/tui-shell.history; AI prompt history in ~/.camel/tui-ai-prompt.history.
Keyboard Shortcuts
Global (All Tabs)
| Key | Action |
|---|---|
1 - 0 | Jump to tab by number |
Tab / Shift+Tab | Next / previous tab |
F1 / ? | Context-sensitive help (toggle) |
F2 | Actions menu |
F3 | Switch between integrations (when multiple running) |
F10 | Run menu (run, stop, restart, kill) |
Shift+F5 | Take screenshot |
Ctrl+R | Start/stop tape recording |
Ctrl+C / Q | Quit |
Esc | Close popup / go back / return to Overview |
Source Tab
| Key | Action |
|---|---|
Up/Down | Navigate files (left panel) or scroll source (right panel) |
Enter | Open file or directory |
Backspace | Go to parent directory |
Tab | Toggle focus between file list and source viewer |
Space | Cycle format (YAML/Java/XML) for Camel routes |
i | Toggle inline Camel documentation |
/ | Search in source |
h | Highlight text |
n / N | Next / previous search match |
w | Toggle word wrap |
Esc / c | Close source viewer |
Diagram Tab
| Key | Action |
|---|---|
Arrow keys | Navigate between route boxes (topology) or EIP nodes (drill-down) |
Enter | Drill down into selected route / jump to linked route |
Esc | Go back (previous route or topology) |
t | Jump to topology view |
m | Toggle metrics overlay |
e | Cycle external endpoints (off / edges / all) |
n | Toggle description labels |
c | View route source code |
Highlighted Features
Beyond the core tabs described above, the TUI includes several specialized screens worth highlighting.
CVE Audit
The CVE Audit tab (under More > Project) scans all Maven dependencies on your integration’s classpath against the OSV.dev vulnerability database. It queries every JAR using the OSV batch API and displays known vulnerabilities grouped by severity (Critical, High, Medium, Low).
Each vulnerability shows the CVE ID, affected artifact, the direct dependency that pulls it in (VIA column), and a summary. Select a CVE to see full details including CVSS vector, published date, fixed versions, and aliases. Results are cached globally — switching integrations that share JARs is instant.
Kafka
The Kafka tab (under More > Data) provides a dedicated view for Kafka consumers and their connectivity status. It shows consumer group details, topic assignments, partition offsets, and reconnection state. When a broker connection drops, the Recovery Tasks tab shows the reconnection task with its Waiting/Attempting status, retry count, and error details.
SQL Query and SQL Trace
When your integration includes a DataSource, two SQL tabs appear under More > Data:
-
SQL Query — an interactive SQL console where you can write and execute queries against any DataSource in your integration. Results are displayed as a formatted table with column types.
-
SQL Trace — captures and displays SQL statements executed by your routes in real-time, showing query text, execution time, and the route that triggered them.
Memory Leak Detection
The Memory Leak tab (under More > JVM) uses Java Flight Recorder (JFR) to diagnose memory leaks in your running integration. It runs two sequential recordings and compares object retention trends, classifying each class as growing, stable, shrinking, new, or gone. This is lightweight and safe for production use.
JFR Runtime Profiling
The JFR tab (under More > Observability) gives you a lightweight profiling view of your running integration using Java Flight Recorder. JFR is built into the JVM with very low overhead, making it suitable for near-production use cases where you need timing data without impacting throughput.
Start your integration with JFR runtime instrumentation enabled:
camel run my-route.yaml --jfr The JFR tab shows the recording status and event configuration. Press F5 to take a snapshot of the active recording — the TUI aggregates all Camel events and presents them in five views:
-
Routes (key 1) — per-route totals, failure counts, and min/mean/max duration
-
Processors (key 2) — per-processor statistics with type and owning route, sorted by slowest first
-
Endpoints (key 3) — per-endpoint send statistics with duration
-
Failures (key 4) — recent exchange failures with exception type and message
-
Redeliveries (key 5) — recent redelivery attempts with attempt and max counts
Press Enter on a route to drill down into its processors filtered by that route. Press s to cycle sort columns, and Esc to go back.
Each snapshot is a point-in-time read — the recording keeps running, so you can press F5 again at any time to see updated statistics as more messages flow through the system.
AI Integration (MCP)
The TUI includes an embedded MCP (Model Context Protocol) server that lets AI coding assistants interact with the dashboard.
The TUI is fully functional on its own — AI integration is entirely optional.
Why This Matters
When an AI agent connects to the TUI via MCP, it gains the same level of visibility that you have — and can act on it. The agent can:
-
Read everything — route topology, statistics, message traces, errors, logs, source files, health checks, and JVM metrics
-
Navigate and control — switch tabs, select routes, start/stop routes, send test messages, change log levels
-
Teach and present — the AI can control the TUI screen to walk you through concepts, highlight areas of interest, draw annotations, and take screenshots. It can circle a failing route, draw arrows between connected endpoints, and add explanatory text labels — turning the TUI into a live whiteboard for pair-programming
-
Self-troubleshoot — when something fails, the AI can autonomously inspect the error, read the message trace, correlate with route statistics, and produce a diagnostic report with annotated screenshots showing exactly where and why the failure occurred
Enabling MCP
camel tui --mcp This starts an MCP server on localhost:8123 (configurable with --mcp-port). The server is bound to 127.0.0.1 only — it never listens on external interfaces.
When MCP is active, the TUI footer shows the connection status. Use F2 → MCP Info to see server details and MCP Log to view the tool call history.
AI panel slash commands
When the AI panel is open, input that starts with / runs a local panel command instead of sending a question to the configured AI provider. /provider and /model are unavailable while a response or command is already in progress; the panel shows a message asking you to wait.
| Command | Description |
|---|---|
| Show the available slash commands. |
| Open the provider switcher. |
| Show the current model, or switch the session model. |
| Clear the AI conversation, usage counters, and model context without changing the provider or model. |
| Close the AI panel. |
| Exit the TUI. |
| Run |
| Run |
| Send a message through |
Submitted prompts (including slash commands) participate in AI prompt history when camel.tui.ai.promptHistory is not 0. Use ↑/↓ on the prompt line to recall them.
Connecting an AI Agent
To connect Claude Code to the TUI, add the MCP server to your project configuration (.mcp.json in your project root):
{
"mcpServers": {
"camel-tui": {
"type": "url",
"url": "http://localhost:8123/mcp"
}
}
} What AI Agents Can Do
The MCP server exposes tools organized by purpose:
-
Observe — read the screen, get structured state, query tables/logs/errors/traces/topology/diagram/files
-
Navigate — switch tabs, select integrations, select routes, send keystrokes, apply filters
-
Act — send test messages to endpoints, start/stop/restart routes, change log levels
-
Annotate — locate text and diagram nodes by coordinates, draw shapes (boxes, highlights, arrows, underlines, text labels), show captions with typewriter animation
-
Present — take screenshots, record tape sessions, control demo pacing
Example Workflows
-
"What routes are failing and why?" — The agent reads the errors tab, correlates with route statistics, steps through the failing exchange in the Inspect tab, and explains the root cause with annotated screenshots.
-
"Show me how this message flows through the system" — The agent navigates to the Inspect tab, opens the diagram replay, steps through each processor, and highlights the path on the topology while explaining what happens at each step.
-
"Highlight the bottleneck routes" — The agent reads the route statistics, locates the slowest routes on the diagram, draws red boxes around them, and adds labels with the processing times.
See Camel MCP Server for more about MCP and AI integration with Camel.
Web Browser Access
The TUI can also be reached from a web browser on the same host, using the same dashboard you’d see in a local terminal — useful when you prefer a browser session to a terminal window.
camel tui --web This starts a web terminal server on localhost:8090 (configurable with --web-port). Open http://localhost:8090 in a browser to get a full xterm.js terminal driving the same TUI dashboard, with the same tabs, keyboard shortcuts, and F2 actions menu as a local session.
Like the MCP server, the web server is bound to 127.0.0.1 only — it never listens on external interfaces — and there is no authentication beyond that. Each browser connection gets its own independent TUI session (its own process discovery and navigation state), the same as if you’d run camel tui again in a new terminal.
Recording Demos
The TUI can record terminal sessions for demos and documentation.
Live Recording
Press Ctrl+R (or use the F2 actions menu) to start recording your session as a .tape file. Press Ctrl+R again to stop. The tape captures your keystrokes with timing, producing a script that can be replayed or converted to an animated GIF.
Scripted Recording
Use the --record flag to replay a .tape file in headless mode and produce an Asciinema .cast recording:
camel tui --record=demo.tape Command Line Options
| Option | Description | Default |
|---|---|---|
| Name, PID, or directory path of a Camel integration. When a directory is given, the TUI opens it as a project in the Source tab — you can browse the source code and run it with F10. When omitted, the TUI auto-discovers running integrations. | |
| Enable the embedded MCP server for AI agent access to the TUI. |
|
| Port for the embedded MCP server. |
|
| Enable the browser-accessible terminal (WebSocket) server. |
|
| Port for the web terminal server. |
|
| Screen refresh interval in milliseconds. |
|
| Color theme for this session (e.g., | |
| Replay a |