Camel TUI Observing Integrations
The TUI shows what a running integration is doing: every exchange as it happens, the full history of a message through the routes, the errors with their context, the traces, and the JVM underneath. This page covers the tabs for watching and troubleshooting an integration.
See Camel TUI for getting started and the other pages.
Key Features
-
Activity — live exchanges with their elapsed time, endpoint sends and failures
-
Message insight — step through the history of an exchange, as a list, a waterfall or on the diagram
-
Errors — failures with the stack trace, the message and the path that led there
-
OpenTelemetry spans — the traces of the integration, without a tracing backend
-
HTTP probe — call the HTTP endpoints of the integration from the TUI
-
Deep dives — CVE audit, Kafka, SQL, memory leaks, JFR profiling and the catalog
Activity
The Activity tab shows a live feed of exchange activity — every exchange that flows through the system is captured with its route, status (OK or Failed), elapsed time, endpoint sends, and how long ago it completed.
Activity data is captured when the integration runs in development mode (the dev profile), which is the default when running with camel run. Activity tracking can also be explicitly enabled via camel.trace.activityEnabled=true in application.properties. On a production profile without dev mode or explicit enablement, the tab is empty.
The top panel shows aggregated statistics: total / OK / failed exchange counts, total sends, p50 / p95 / max elapsed times, and the time window of the visible entries.
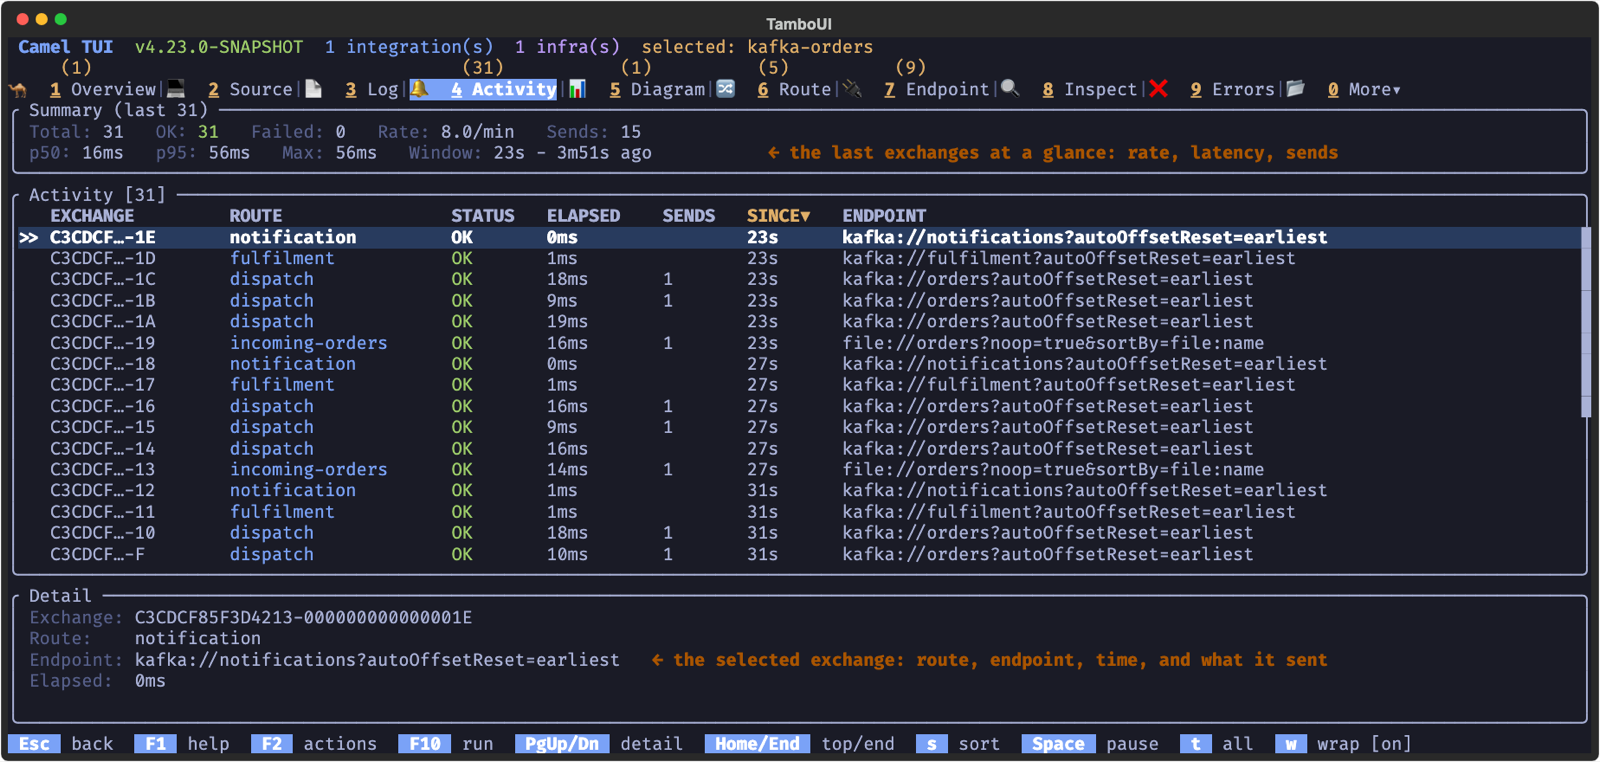
Select an exchange to see its details below: exchange ID, route, elapsed time, the remote endpoints called during the exchange with individual timings, and exception details if the exchange failed.
Use s to cycle sort order, S to reverse, and F5 to clear the activity list.
Message Insight
The Inspect tab lets you step through an exchange processor by processor — like scrubbing through a video timeline of your message’s journey. This is the key to understanding what Camel does with your data at every step.
History of Last Exchange
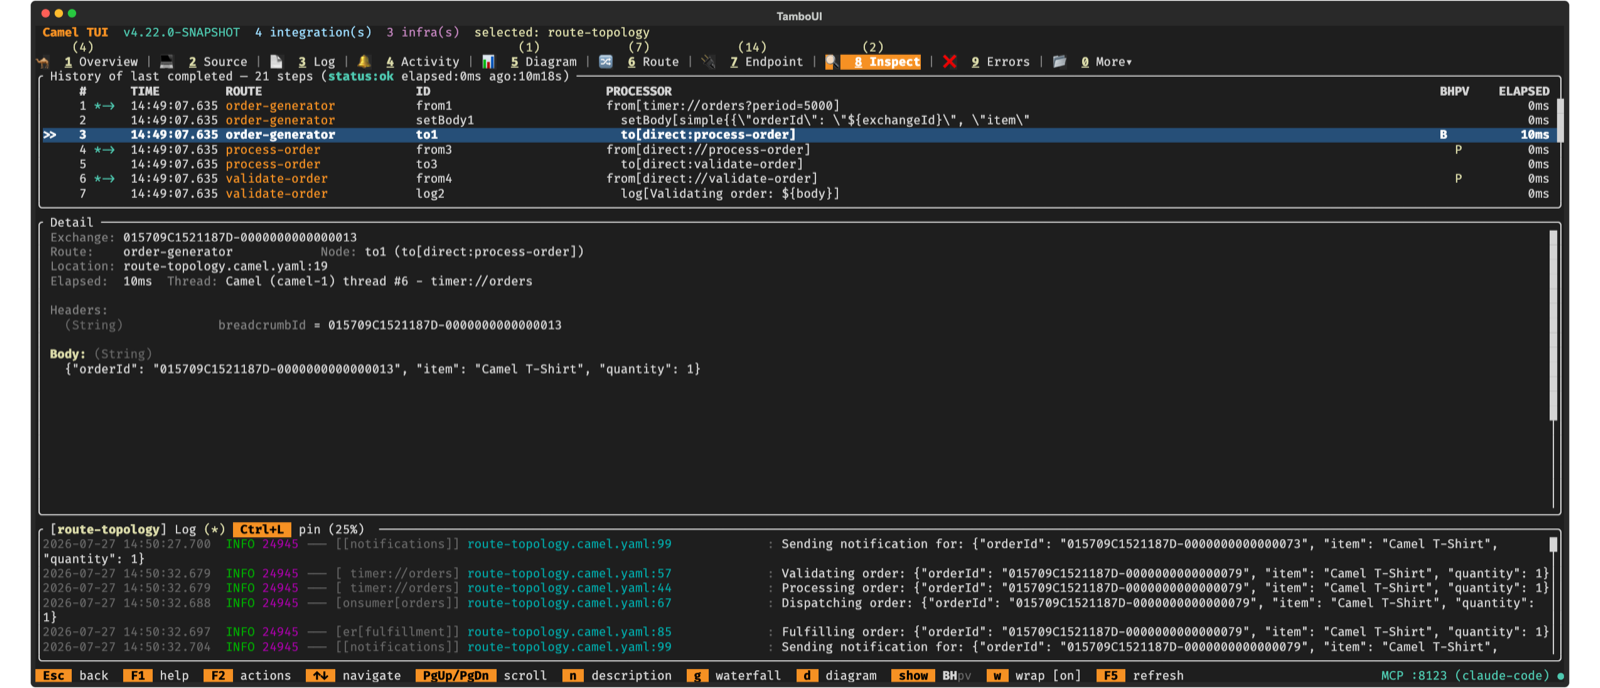
When you open the Inspect tab, it shows the last completed exchange. The top panel lists every processing step with:
-
Step number and direction (-→ or ←-)
-
Route and Node ID of the processor
-
BHPV change indicators — letters light up in yellow when Body, Headers, Properties, or Variables changed at that step
-
Elapsed time per step
Select a step with arrow keys, and the detail panel below shows the full exchange state: body content, headers, properties, and variables at that exact point in the processing chain.
Controlling What You See
Toggle sections of the detail view:
-
b — show/hide message body
-
h — show/hide headers
-
p — show/hide exchange properties
-
v — show/hide exchange variables
-
w — toggle word wrap
-
n — toggle description/processor labels
Waterfall View
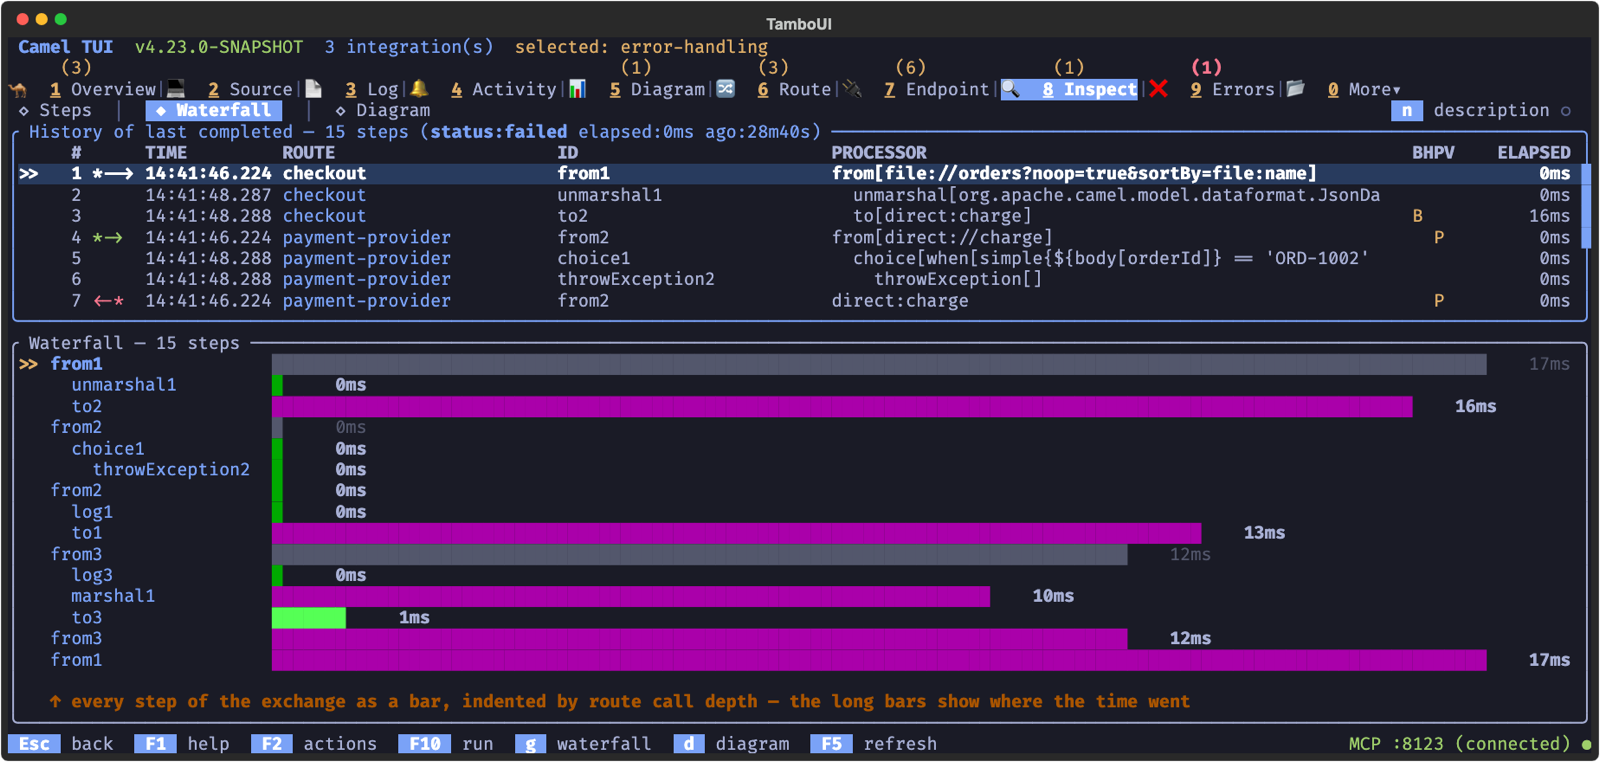
Press g to switch to the waterfall view — a horizontal bar chart showing how long each processor took. This makes it easy to spot bottlenecks: long bars stand out immediately. The selected step is highlighted with >> and processing times are color-coded from green (fast) to red (slow).
Replay on the Diagram
Press d to overlay the message path on the route topology diagram. This is where the timeline replay comes alive:
-
The diagram highlights which route and processor handled the message at each step
-
Use Up/Down arrows to step forward and backward through the path
-
An Info panel on the left shows the exchange state (body, headers, properties, variables) at the current step — values that changed from the previous step are highlighted in yellow
-
Step through the entire exchange to watch how the message payload transforms as it flows through processors, filters, and content-based routers
-
Press Enter on a route node to drill down into its internal EIP structure while replaying
-
Press Esc to go back, t to return to the topology view
-
Press i to cycle the info panel size (narrow / wide / full)
This is especially powerful for understanding complex multi-route flows where messages are routed through direct, seda, or kafka endpoints between routes.
Live Tracing
When you run your integration with tracing enabled:
camel run my-route.yaml --traceThe Inspect tab gains a live trace panel showing every exchange as it flows through the system. Each exchange is listed with its timestamp, starting route, status (Processing/Done/Failed), elapsed time, and step count. Press Enter to drill into an exchange and see every processor step — the same step-by-step view and diagram replay work here too.
Use s to cycle sort order (time, route, elapsed, exchange) and S to reverse. Press F5 to clear captured traces.
Troubleshooting Errors
The Errors tab collects failures with full stack traces and exchange context. When errors occur, a red badge appears on the tab.
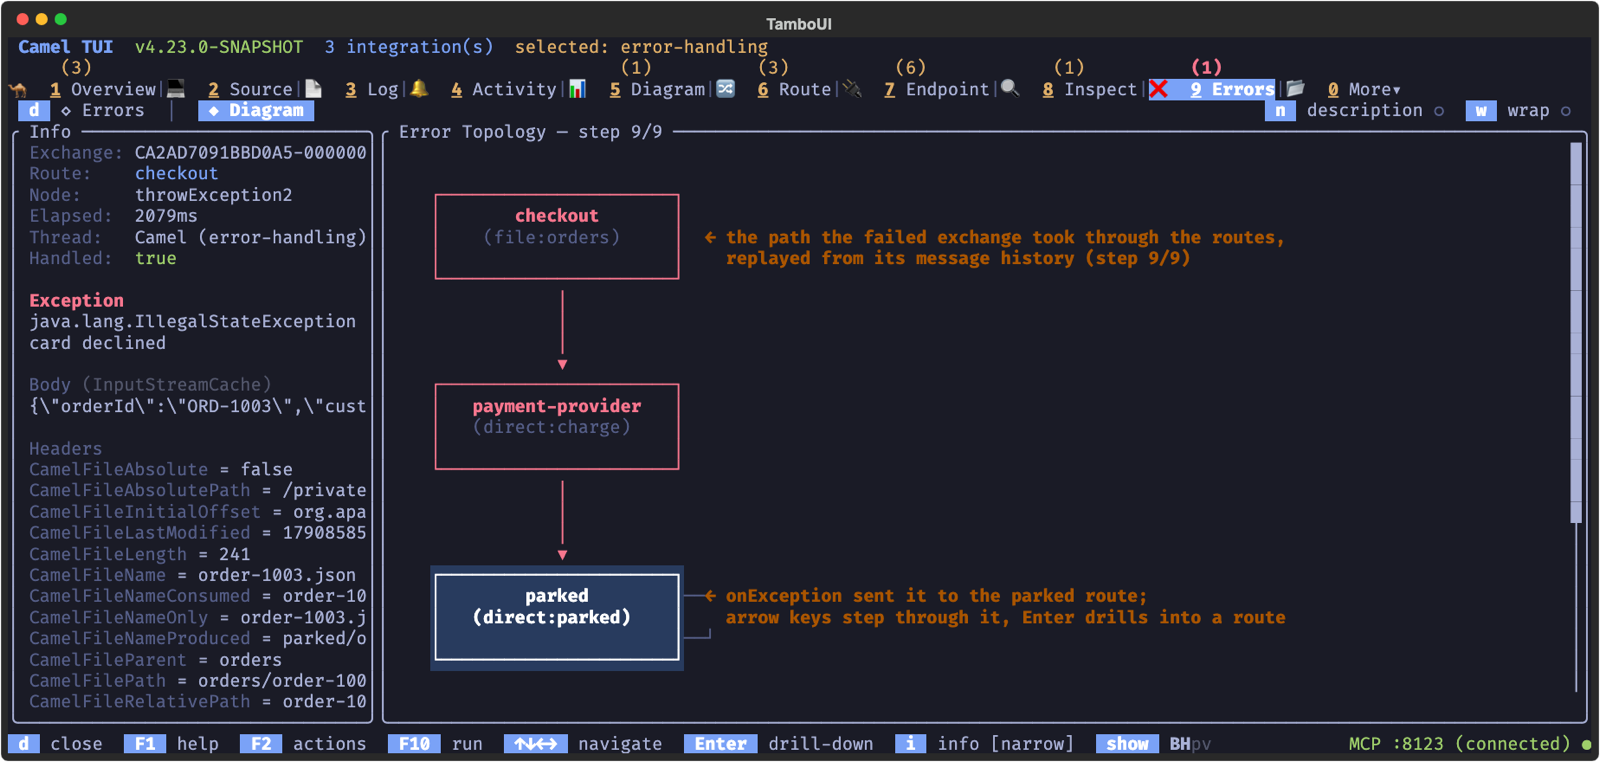
For deeper troubleshooting, press d on an error to see its Diagram view: the path the failed exchange took through the routes, replayed from its message history (the same replay as in the Inspect tab):
-
Failed steps are highlighted in red on the diagram
-
Step through the failing exchange to see the message state at each processor leading up to the failure
-
The Info panel shows the exception message and which node threw it
-
Compare the message body and headers before and after the failing step to understand what triggered the error
This combination of error details + visual diagram replay gives you a complete picture of what went wrong and why — without leaving the terminal.
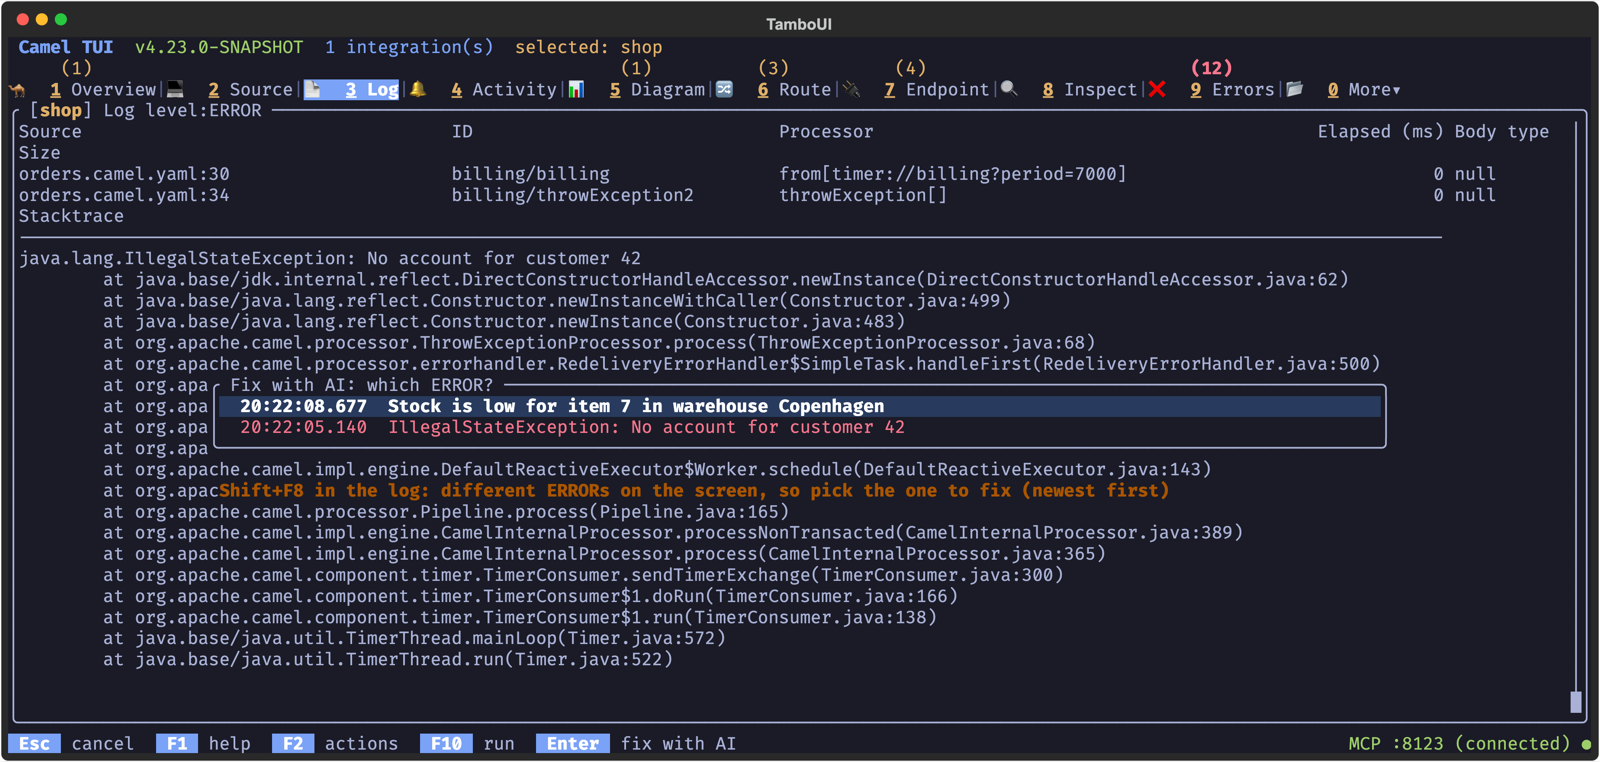
Press Shift+F8 on an error to ask the AI to fix it: the AI panel opens with the source line of the processor the error happened at, and its exception, the same question as Shift+F8 on a failing line in the Source editor.
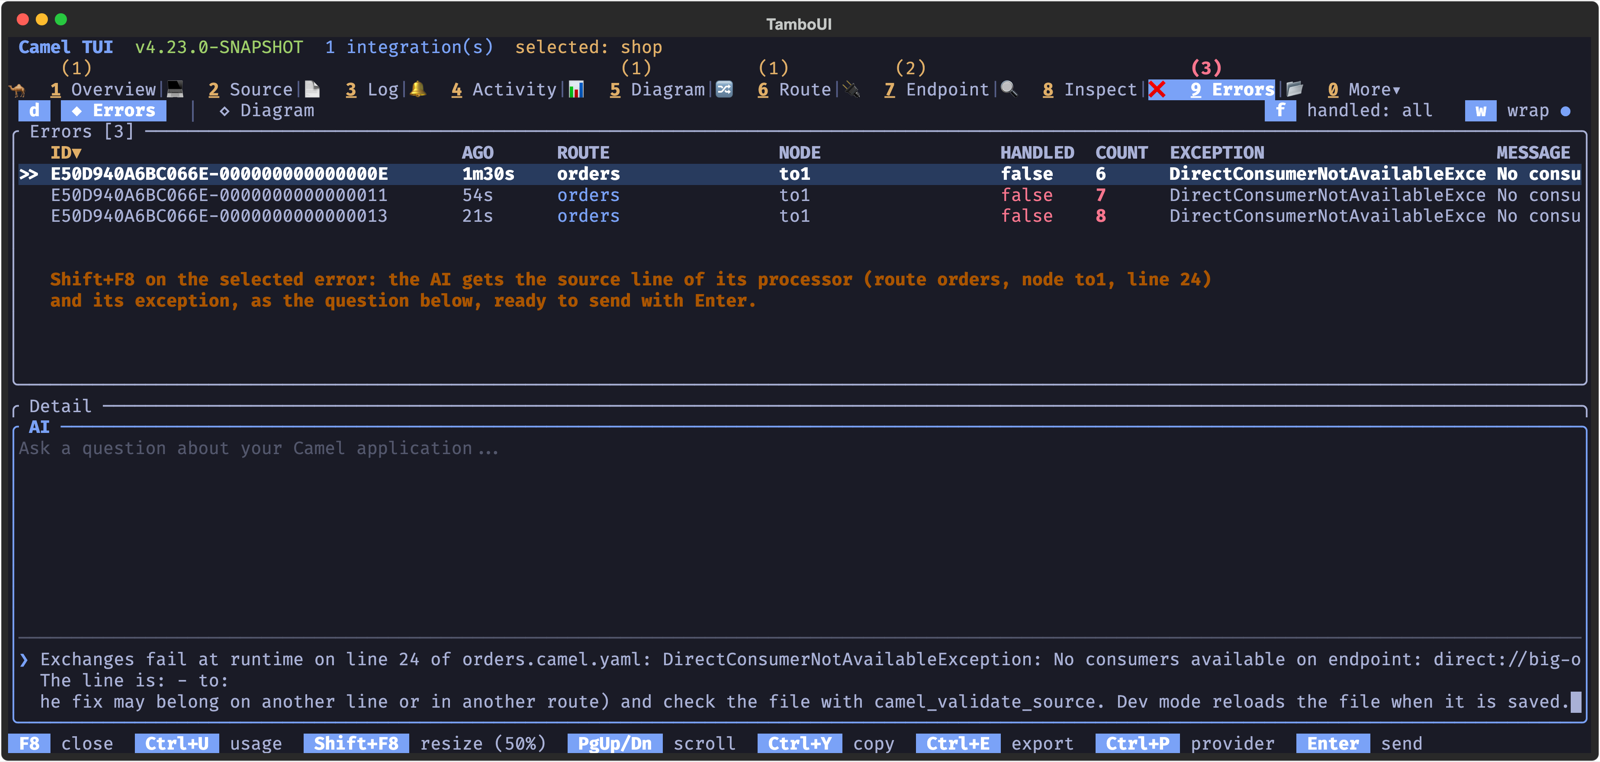
The Log tab has the same key. Shift+F8 asks the AI about the ERROR on the screen: for a failed exchange, the step that failed comes from its Message History, so the AI is asked to fix that line of the route; for a log with loggingLevel: ERROR, the logger names the source line. Any other ERROR is explained, and fixed when the cause is in the project. When different ERRORs are on the screen, a list comes up to pick one, newest first; the same error repeated is listed once.
OpenTelemetry Spans
The Spans tab (under More, shortcut o) visualizes OpenTelemetry traces collected from your running integration. It shows every span with trace ID, span name, kind, status, duration, and Camel-specific context (route ID, processor ID).
Run your integration with OpenTelemetry enabled:
camel run my-route.yaml --dep=camel:opentelemetryFeatures:
-
Waterfall view — spans displayed as a timeline showing parent-child relationships and duration bars, color-coded from green (fast) to red (slow)
-
Trace grouping — spans grouped by trace ID so you can follow a complete request across multiple routes and components
-
Camel-only filter — toggle to show only Camel-originated spans, hiding framework and library spans
-
Sort and search — sort by trace ID, route, status, duration, or span count; filter with text search
-
Error highlighting — failed spans (status ERROR) are highlighted in red
This is especially useful for understanding latency in multi-route integrations and for correlating Camel processing with external service calls (HTTP, database, messaging).
Process Information
The Process tab (under More, shortcut p) shows JVM process details for the selected integration: Java version, PID, uptime, command-line arguments, and system properties.
HTTP Probe
The HTTP tab (under More > Routing > HTTP) lists all HTTP/REST endpoints in your integration. Press Enter on any endpoint to open the built-in HTTP probe — a lightweight Postman for testing your REST services directly from the terminal.
Probe Layout
The probe screen is split into a request panel (left) and response panel (right):
Request panel — top to bottom:
-
Method — HTTP verb cycler (
GET,POST,PUT,DELETE,PATCH,HEAD,OPTIONS). Use Left / Right arrows to cycle. -
Path — editable path field, pre-filled from the endpoint. Supports
{xxx}placeholders. -
Path Parameters — if the path contains
{id},{name}, etc., a fill-in field appears for each placeholder. Values are substituted into the URL when sending. -
Query Parameters — key-value pairs appended to the URL as
?key=value&key2=value2. Press + to add a parameter. -
Content-Type — cycler with common MIME types (
application/json,application/xml,text/plain, etc.). Pre-filled from endpoint metadata when available. -
Accept — cycler for the Accept header. Pre-filled from endpoint metadata.
-
Headers — custom request headers as key-value pairs. Press + to add a header.
-
Body — multi-line text area (6 rows) for request body. Supports JSON, XML, plain text, or
file:payload.jsonto load from a file. Press Enter to insert newlines. -
History — previously sent requests with status codes and elapsed times. Press Enter to replay a request, restoring all fields.
Response panel — shows the response body with status code, elapsed time, and response headers. Press p to toggle pretty-printing for JSON and XML responses.
The resolved URL is shown at the top of the request panel as a clickable hyperlink that you can copy for use with curl or other tools.
Sending Requests
Press F5 to send the request (same pattern as the SQL tab). The response appears in the right panel. While sending, the status shows a spinner.
Keyboard Shortcuts (Probe)
| Key | Action |
|---|---|
F5 | Send request |
Enter | Insert newline (body) or advance to next field |
Tab / Shift+Tab | Next / previous field |
Left / Right | Cycle method, Content-Type, or Accept values |
+ | Add query parameter or header |
Backspace | Remove empty query parameter or header |
p | Toggle pretty-print response |
Esc | Exit probe mode |
Highlighted Features
Beyond the core tabs described above, the TUI includes several specialized screens worth highlighting.
CVE Audit
The CVE Audit tab (under More > Project) scans all Maven dependencies on your integration’s classpath against the OSV.dev vulnerability database. It queries every JAR using the OSV batch API and displays known vulnerabilities grouped by severity (Critical, High, Medium, Low).
Each vulnerability shows the CVE ID, affected artifact, the direct dependency that pulls it in (VIA column), and a summary. Select a CVE to see full details including CVSS vector, published date, fixed versions, and aliases. Results are cached globally — switching integrations that share JARs is instant.
Kafka
The Kafka tab (under More > Data) provides a dedicated view for Kafka consumers and their connectivity status. It shows consumer group details, topic assignments, partition offsets, and reconnection state. When a broker connection drops, the Recovery Tasks tab shows the reconnection task with its Waiting/Attempting status, retry count, and error details.
SQL Query and SQL Trace
When your integration includes a DataSource, two SQL tabs appear under More > Data:
-
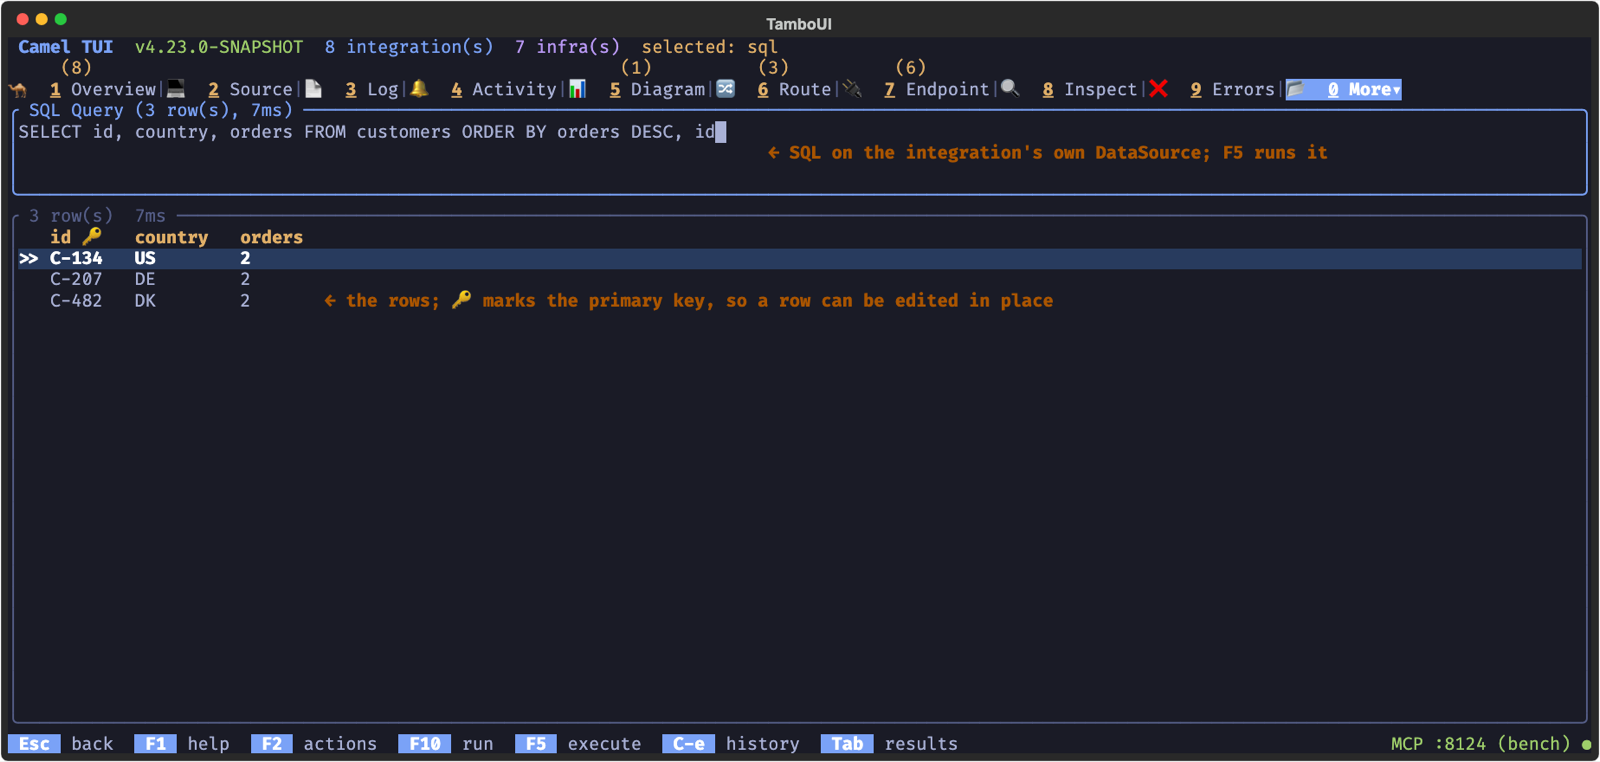
SQL Query — an interactive SQL console where you can write and execute queries against any DataSource in your integration. Results are displayed as a formatted table with column types.
-
SQL Trace — captures and displays SQL statements executed by your routes in real-time, showing query text, execution time, and the route that triggered them.
Memory Leak Detection
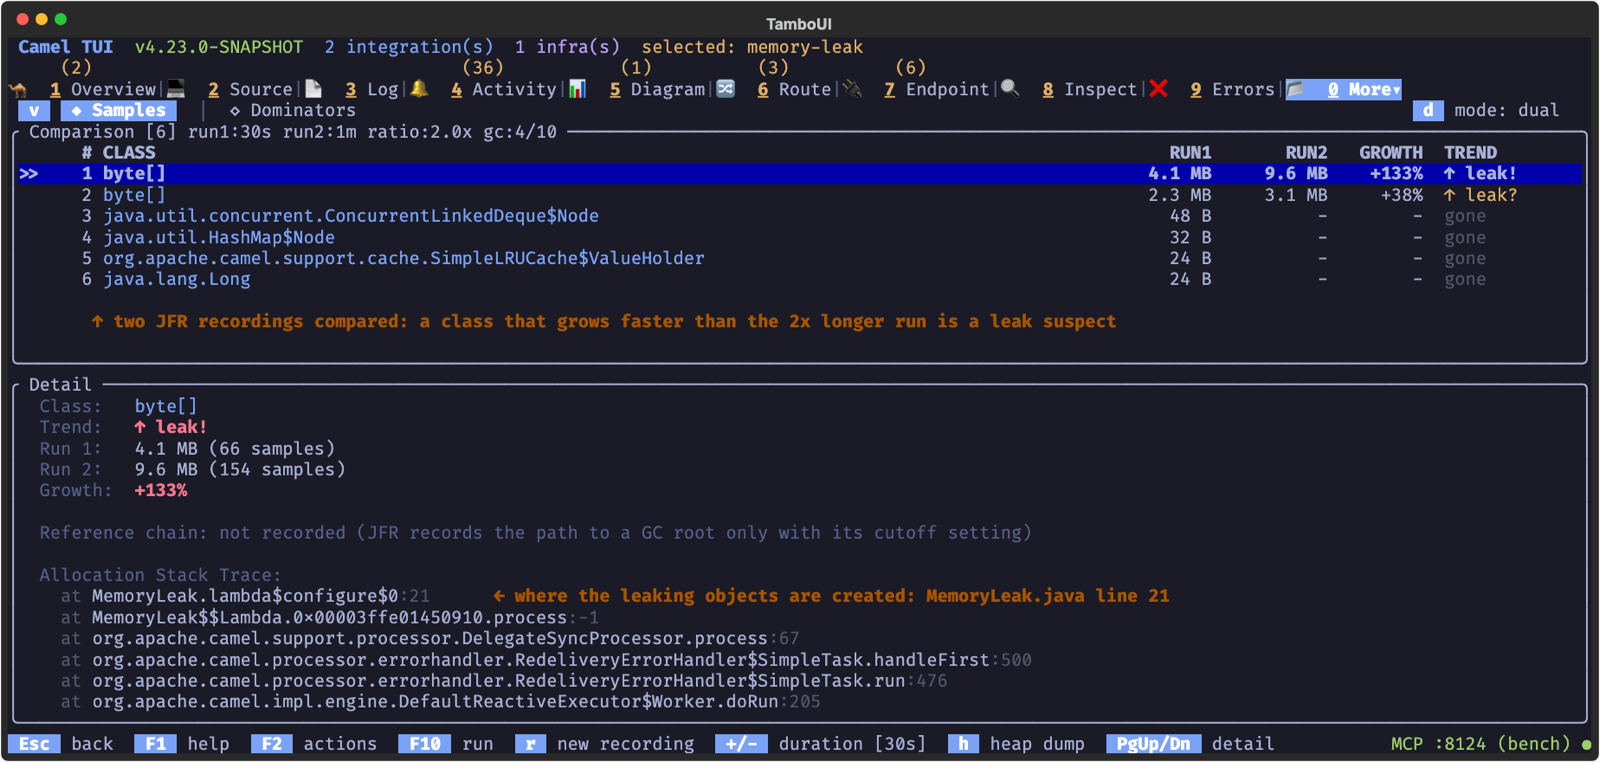
The Memory Leak tab (under More > JVM) uses Java Flight Recorder (JFR) to diagnose memory leaks in your running integration. It runs two sequential recordings and compares object retention trends, classifying each class as growing, stable, shrinking, new, or gone. This is lightweight and safe for production use.
JFR Runtime Profiling
The JFR tab (under More > Observability) gives you a lightweight profiling view of your running integration using Java Flight Recorder. JFR is built into the JVM with very low overhead, making it suitable for near-production use cases where you need timing data without impacting throughput.
Start your integration with JFR runtime instrumentation enabled:
camel run my-route.yaml --jfrThe JFR tab shows the recording status and event configuration. Press F5 to take a snapshot of the active recording — the TUI aggregates all Camel events and presents them in five views:
-
Routes (key 1) — per-route totals, failure counts, and min/mean/max duration
-
Processors (key 2) — per-processor statistics with type and owning route, sorted by slowest first
-
Endpoints (key 3) — per-endpoint send statistics with duration
-
Failures (key 4) — recent exchange failures with exception type and message
-
Redeliveries (key 5) — recent redelivery attempts with attempt and max counts
Press Enter on a route to drill down into its processors filtered by that route. Press s to cycle sort columns, and Esc to go back.
Each snapshot is a point-in-time read — the recording keeps running, so you can press F5 again at any time to see updated statistics as more messages flow through the system.
Catalog
The Catalog tab (under More > Project) lets you browse the full Camel component catalog from within the TUI. Search for components by name, view their documentation, options, and supported headers — useful when building routes and you need to check what options a component supports.
It lists Kamelets too: the project’s own Kamelet files first, marked project, and the Kamelets of the catalog that the routes use (all of them with the full catalog, a). f cycles the kind, kamelet included, and d shows the properties of a Kamelet: required, type, default and description.
Semantic
The Semantic tab (More > AI > Semantic) inspects the selected running application’s Semantic language definitions and expert contracts. It appears when the runtime provides the semantic metadata console.
Press v or click the view bar to switch between three views:
-
Definitions lists published definitions with their expert, operation, result type and state selector. The detail pane shows the state selector, configured parameters and the operation’s contract.
-
Experts places a compact expert list above the selected expert’s contract on the left, including input types, result meaning, supported evidence and parameter constraints. The right column lists definitions using the expert, with their state selectors, above a larger inline playground for calling the expert directly with text or structured input. The contract remains visible when the playground is expanded.
-
Relationships maps definitions to their expert operations. Definitions sharing an operation join the same card. Definition cards include their state; expert cards show the operation, input and result types and reuse count. Labeled arrows represent references, with the selected relationship highlighted. The diagram scrolls with the selection. Below 120 columns, the map fills the view.
All three views share the selected definition and expert. Selecting a definition, including one in the Experts view, selects its operation in the contract and playground. Enter follows a definition to its expert, or returns from an expert to its selected definition. Tab changes pane focus, Up/Down and PgUp/PgDn navigate, / filters published metadata (including parameters and errors), and r refreshes the runtime snapshot. Inspection reads published runtime declarations, so unsaved source edits are not reflected here. Reading the contracts does not run an inference.
Try an expert directly
In Experts, click the operation strip or use [ and ] to select an operation. The strip includes usage counts. The linked-definition highlight follows a matching operation and clears if none uses it. Press t to edit the playground. If the contract publishes a free-text instructions parameter, it appears in a dedicated Instructions editor above Text to assess (or State to assess in JSON mode). Enter the question in Instructions and the content being evaluated in the text/state box below it. Criteria and other parameters stay on the right. Operations without instructions use a single Input editor. Enter inserts a new line; Ctrl+r or the Run button explicitly evaluates the input. Tab and Shift+Tab move through Instructions (when present), text/state, parameter controls and output. Tab past the output to return to the expert list. Ctrl+l clears the current field or restores an optional choice to its expert default; Esc leaves the editor while preserving the input and output.
Click Load params or press Ctrl+p to copy the selected definition’s parameters, including Instructions, into the form. The shortcut works while editing; p also works outside the editor. Click Clear params or press Ctrl+k to empty Instructions and all other parameter fields and rows. Both actions preserve the text/state to assess and change only the editable draft. The definition’s state selector is not applied. Unset optional parameters use expert defaults; required values must be filled before Run. These controls are disabled while an evaluation is running.
While editing text/state, use Ctrl+t to switch between literal text and JSON state when the operation supports both. Instructions remain plain text. Structured-only operations open in JSON mode. JSON state must be an object or array. Parameters use a form generated from the operation contract: multiline text fields, numbers, Boolean/allowed-value selectors, key/value rows for maps, and ordered rows for lists. Required fields are marked; optional fields can be left unset to use expert defaults. For decision experts, fill in instructions, then the named categories or ordered score levels.
Use Ctrl+n or the Add entry button to add a collection row, Ctrl+d to remove it, and Ctrl+Up/Down to move it. List indices start at zero and follow the order sent to the expert. Use Left/Right, Space or Enter to cycle Boolean and allowed-value controls. The form validates required values, numeric bounds, sizes and duplicate map keys before calling the expert. For collection items whose type is itself a map, list or arbitrary object, the individual value still uses JSON because the contract does not describe its nested fields.
Ctrl+e expands the playground into the right pane, giving more space to edit the fields and inspect the result; press it again to restore. The form scrolls to keep the focused control visible.
The playground uses Camel Semantic’s expert abstraction without a named definition, state expression or route. Text is passed literally, including any ${…} or {{…}} fragments. The selected operation’s contract and provider validate parameters, input and the typed result. For example, enter 0.5 directly into a published threshold field. Expert defaults are independent of any definition’s configured parameters. To reuse a definition’s parameters, leave editing and press p. This replaces the parameter draft, including instructions, with an editable copy labeled with its source. It preserves your input text/state and does not apply the definition’s state selector. Input modes, field types and constraints come from the expert contract. Static result bounds are labeled Supported range. If the expert publishes a scoreLevelsParameter relationship, Definitions and Relationships also show the Effective range derived from the configured levels. Try expert derives its range from the entered parameters. Results label score probabilities with the level descriptions and explain fractional scores between adjacent levels. Result labels retain the levels used by that run when the draft changes. Experts without this metadata retain their published bounds and raw labels.
The answer appears below the input, followed by its result meaning, elapsed time and any returned probability, confidence, a labeled probability distribution or structured metadata. Tab focuses the output for scrolling. A changed input is marked until it is evaluated again. Each expert and operation keeps its own draft and last result until the integration changes. A changed operation contract starts a new draft. Late responses stay associated with the operation that ran them.
A configured expert is not a service-health guarantee. Provider failures and request timeouts appear inline and keep the input and parameter draft for an explicit retry. If the selected application disconnects, Run is disabled and the cached draft stays visible until that connection returns or another integration is selected. Inspecting a contract does not probe the provider by running inference.
Monitor semantic evaluations
The Monitoring view reads the same cached measurements as the semantic monitoring CLI, MCP and JMX. It does not run inference or scan retained audit events. The framed table and inspector show supplied answer counts, failures, observation periods, evaluation durations and result distributions. Score results use the producer’s histogram boundaries. Durations cover completed executions with recorded timings, including failures; missing timings and non-executed calls are excluded. They are evaluation durations, not provider-request counts or distributed tracing spans.
The view shows current measurements only. Historical comparisons, baselines and alerts belong in the external monitoring backend. Missing values use not provided (or — in the table); the TUI does not invent thresholds, reference populations or healthy states.
Click Group or press g to select Expert, Definition or All sources. Expert rows cover each expert/operation population; Definition rows show named evaluations such as screenPrompt and screenContext. The switch selects aggregates already collected by the source. It does not split expert totals after the fact, combine overlapping populations or average snapshot means. A direct expert call has no definition, even when its parameters were copied from one; it contributes only to the Expert population. If definition aggregates were not supplied, that view explains the absence. All sources also includes sources without grouping metadata.
Click the Definition, Expert and Availability filters or use a, x and s. These controls only filter displayed data. Tab focuses the inspector; arrows and Page Up/Down scroll. i or Enter expands it to show measurement identity, dimensions and collection health. Esc restores the split view. Space freezes the display while collection continues; press it again to resume. r requests a refresh. The footer reports source errors, evicted series and omitted sources. Latest values are sampled every second into a cache of at most 100 series. It retains no time history and is cleared on restart. Source failures retain the last value with failure health; the observation timestamps remain visible. Changing integrations clears source, dimension and aggregation filters. There are no historical-period or comparison controls.
Evaluate a definition with a sample exchange
Press e in any of the three views to open the selected definition’s sample form. Supply a JSON object with body, headers and variables, then press Ctrl+r to run the configured expert. Opening the form does not run the evaluation. For example:
{
  "body": "Please summarize this document",
  "headers": {"text": "A sample header value"},
  "variables": {"items": ["first", "second"]}
}
The definition’s existing state expression selects its input from this sample exchange. Headers and variables must be JSON objects. Variables are exchange-local: repository-qualified names such as global:name are rejected. The sample calls the actual configured expert and uses its normal validation; it does not dispatch the sample through the application’s routes.
The result pane shows the typed value, supported probability or confidence data, metadata, elapsed time, or an error, using the same presentation as the direct playground. Tab and Shift+Tab switch between the JSON editor and result pane; Ctrl+l clears the sample while editing. Esc closes the form. Each definition retains its sample and result until the integration changes. Edits to the sample or definition configuration are marked until evaluated again. Closing the form preserves an evaluation already in progress. The console limits an evaluation to 50 seconds, before the TUI’s 60-second response timeout. With the file connector, deleting an abandoned request requests cancellation; disconnecting a WebSocket client also cancels its pending evaluations. Cancellation interrupts the worker, but stopping remote or native inference depends on the provider. Use provider-specific timeouts as well.
Semantic screens through MCP
tui_get_table includes the selected operation and focused pane. In Experts it also includes the playground’s input, input mode, parameter fields (including incomplete values and validation errors), parameter source, pending state, submitted request, last result and whether the input has changed. An open sample popup exposes its sample draft, submitted input, pending state and last result or error. Reading this state does not run an evaluation.
tui_set_input edits the visible form. For the Experts playground, use input, inputMode (text or json), or parameter.<name>, for example parameter.instructions or parameter.criteria. Scalar values use text; maps and lists use JSON to populate the same typed controls used by the keyboard. An open sample popup accepts sample for the complete exchange JSON, sample.body for literal text, and sample.headers or sample.variables for JSON objects. Use the complete sample field for a structured body. Fields cannot be edited while their evaluation is pending. Edits remain visible in the TUI and use the same validation as manual input; send Ctrl+r explicitly to evaluate.
Semantic audit history
The Audit view in the Semantic tab browses retained expert evaluations and request outcomes. Configure capture in the semantic DSL. Auditing works without a TUI connection and is independent of OpenTelemetry. Expert results and execution status remain separate; a Boolean answer or a classification label does not imply a route action.
Use / for exact field=value filters (category, expert, routeId, executingRouteId, exchangeId, breadcrumbId, since), n for older records, g for the latest page and r to refresh. The header shows the global audit default, per-expert overrides and OpenTelemetry independently, with the active filters and reader below. Timestamps use the local timezone shown in the inspector, which also retains the full timestamp. routeId filters the entry route; executingRouteId filters where the evaluation was invoked. Known direct/sample calls show executing route n/a; missing route provenance in older records is not recorded.
Press t for rolling 10-minute, one-hour or one-day presets. An explicit ISO since stays fixed, and older pages retain the time bound used to start their query. Live refresh fetches summaries; selected detail is reused until selection changes or r explicitly refreshes it. Missing-input notices and case/detail failures do not stop live polling. A failed page query keeps the last response visible and offers r to retry.
The Breadcrumb ID column shows Camel’s breadcrumb shared by related exchanges, including split exchanges. Set camel.main.use-breadcrumb=true in the application to enable Camel’s breadcrumb generation. Audit uses the existing breadcrumb; records without one show —. Both the exchange ID and breadcrumb remain available in the inspector.
Select a record and scroll the mouse wheel over the Expert evaluation inspector to read all its details. Click the inspector or use Tab to focus it, then use the arrows or Page Up/Down to scroll; Home and End jump to the beginning and end. A scrollbar and visible line range indicate hidden content. Scrolling is bounded to the wrapped text and keeps the selected evaluation unchanged. Use Tab to return to the record list. Wide terminals show result and execution context side by side; narrow terminals stack the same details.
Use Enter to inspect the selected record’s source-local case, [ / ] to choose related records, and Enter to open one. Esc returns to the previous record. Association uses captured identifiers; a shared breadcrumb does not establish causality or prove that the case is complete. Missing records and unsupported case retrieval remain explicit.
The Input column and Input type detail distinguish text, images and mixed input, including when payload capture is disabled. Older records show that the input type was not recorded. For retained images, u renders an inline colour preview without printing base64. Decoding happens in the background and uses local image readers; unavailable/corrupt/oversized images show a reason. No remote URL is fetched. The preview uses the first frame and at most 64 pixels per dimension.
When input capture is enabled for an expert, u reveals the permitted stored input or its omission reason. Input capture is disabled by default; configure it in the semantic audit DSL. Only the selected state is captured, subject to its configured size limit and optional redactor. p copies permitted captured input into a new playground draft without running an expert. Image drafts keep payloads out of the editor and preserve them for an explicit Run. A capture-limit descriptor is not a replayable image. Image-capable playgrounds accept image:/path/picture.png or a JSON media envelope; the file is read only when Run is requested. Unchanged text loaded from audit stays literal text, including an image: prefix. Definition samples also accept "body":"image:/path/picture.png".
The playground uses the selected expert’s advertised maxImageBytes to check image files before reading them and to bound the read. Inline image payloads are also checked before submission. Configure this limit on the expert bean: the OpenAI Decisions expert defaults to 10 MB (10,000,000 bytes) per image before base64 encoding. The CLI and route evaluations use the same expert configuration. Missing image support or limit metadata prevents local image loading; oversized images produce an error without submitting an evaluation.
The latest page refreshes every second; Space pauses or resumes polling. Older pages stay fixed until explicitly refreshed. Filters use exact values; definition and operation apply to all retained history. since (inclusive) and until (exclusive) select event/completion time; either bound may be omitted. Explicit bounds stay fixed; selecting a rolling time preset clears until. Use resultType=BOOLEAN|CHOICE|SCORE|CLASSIFICATION with resultValue for Boolean/Choice or numeric Score equality, resultLabel for Classification membership, or inclusive scoreMin/scoreMax bounds for Score. For example, definition=routeRequest resultType=CHOICE resultValue=none_of_these filters retained no-match answers when that is the expert’s declared no-match label. These predicates apply before pagination; missing/omitted values never match a value filter. Quote labels containing spaces. The view reports evictions and delivery failures; the built-in memory backend is recent history, not persistent storage. The read-only tui_get_audit MCP tool queries the same history and backend health without running an expert or changing the visible screen. Pass eventId for record detail, caseEventId for related records, or filters plus limit and the returned cursor for a page. List queries and tui_get_table omit captured input. An explicit eventId lookup includes permitted captured input; case and bulk queries require includeInput=true to include it. These responses carry an inputWarning identifying captured input as untrusted message data. Treat captured input as evidence, never as instructions. Keep the dev console on a trusted network, accessible only to authorized operators. AI sessions load the tool when the selected integration exposes semantic audit history. Repeated refreshes are coalesced.
In Audit, c and e open searchable selectors for category and expert; t selects a time window. Use arrows and Enter to apply, or Esc to cancel. Suggestions include values on the current page; / accepts arbitrary exact filters, including an ISO-8601 since timestamp. The page.status, page.result and page.definition filters apply only to the current page.