Textual debug for Camel routes allows to set breakpoints at Route definition.
The Debug Adapter for Apache Camel latest release 0.1.1 supports JMX connection. It opens the possibility to start a Camel application with Camel textual route debugging activated in a single Launch Group configuration. I blogged how to achieve similar functionalities in VS Code last week. Let’s see the different configurations required to achieve it with Eclipse Debug Adapter for Camel client.
How to configure Eclipse
Minimal Camel version
Check that Camel 3.16+ is used.
camel-debug on classpath
camel-debug must be on the classpath for the debug session. As it should not be used in production, a good way to achieve it is to use a Maven profile, for instance:
<profiles>
    <profile>
        <id>camel.debug</id>
        <activation>
            <property>
                <name>camel.debug</name>
                <value>true</value>
            </property>
        </activation>
        <dependencies>
            <dependency>
                 <groupId>org.apache.camel</groupId>
                <artifactId>camel-debug</artifactId>
            </dependency>
        </dependencies>
    </profile>
</profiles>
Eclipse Maven Build launch configuration to start application
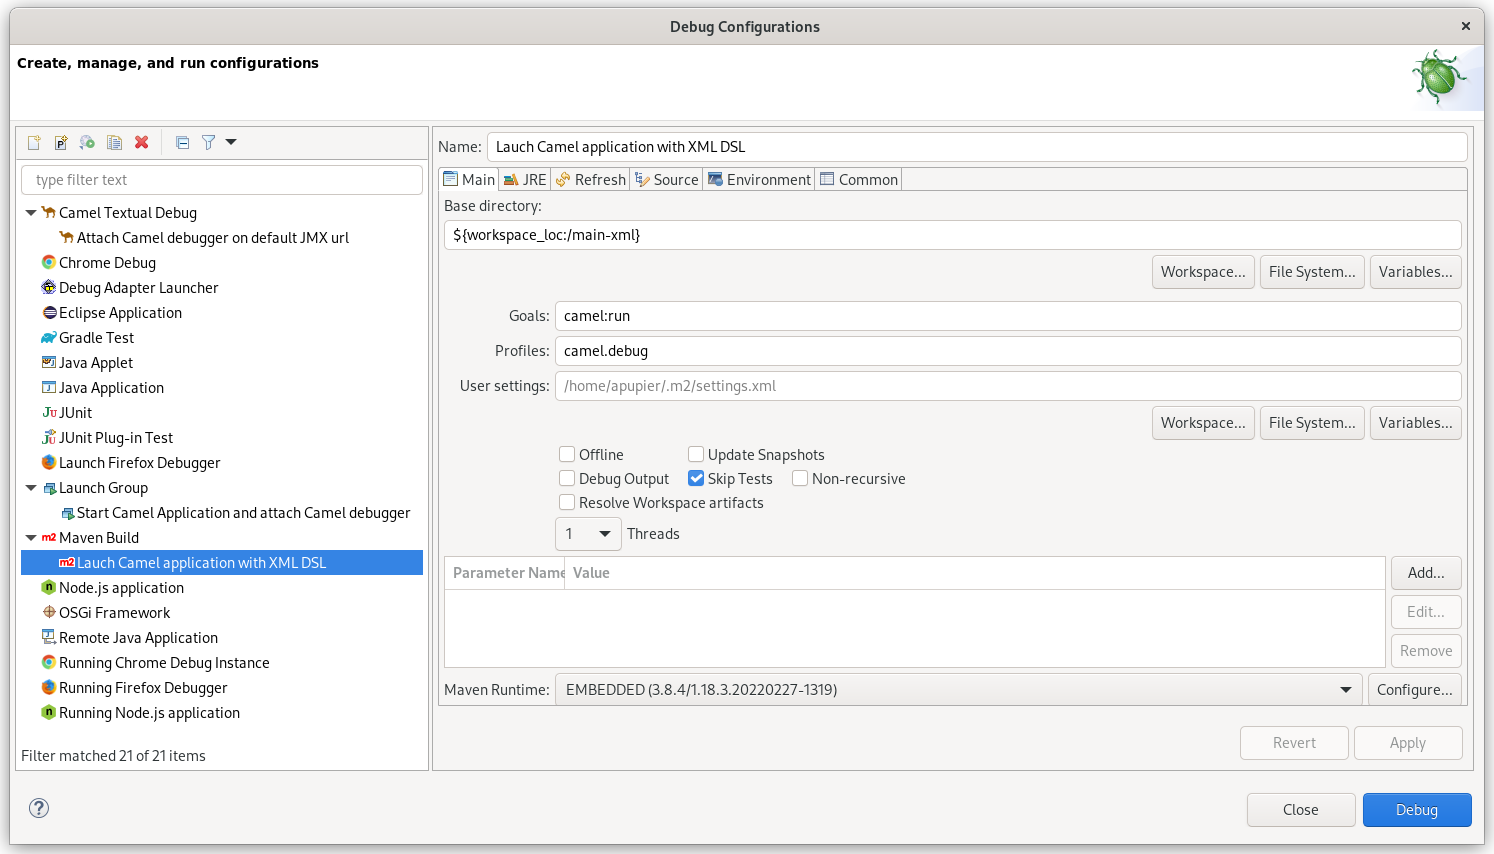
Next step consist in providing a launch configuration to start the Camel application with camel-debug on the classpath by using the camel.debug profile mentioned in previous point.
For that, you need to create a Maven Build launch configuration with goal camel:run and profile camel.debug.
Launch configuration to Attach debugger
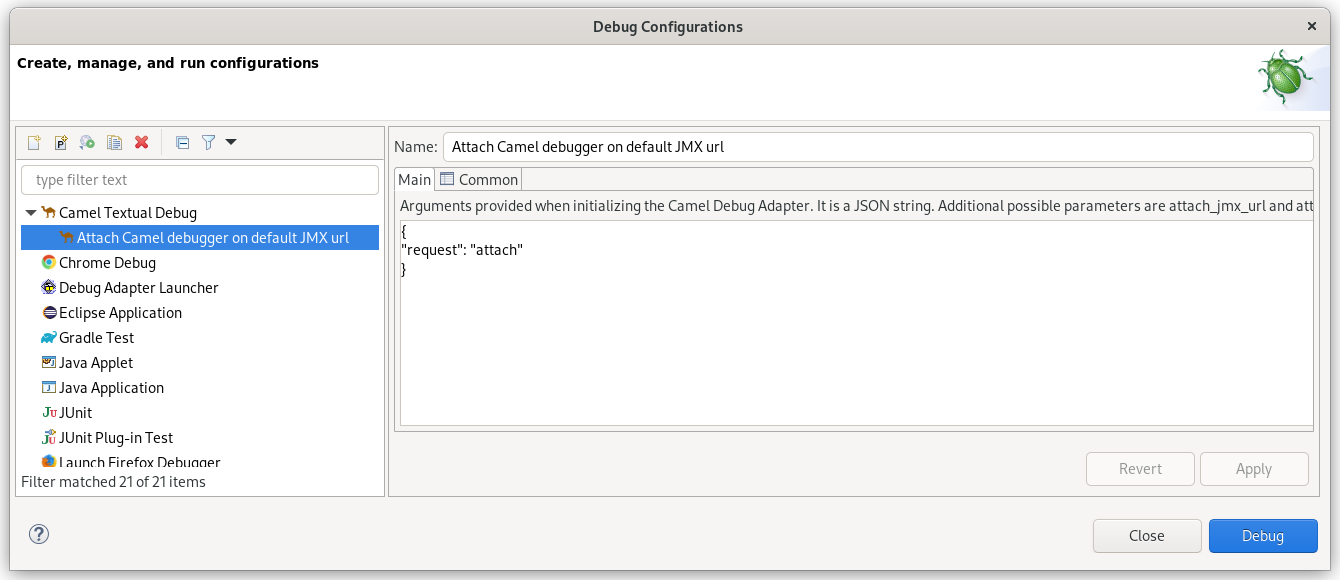
The goal here is to create the launch configuration to attach the debugger. You can create a Camel Textual Debug launch configuration provided in the Debug configuration context and keep the default values.
Launch group
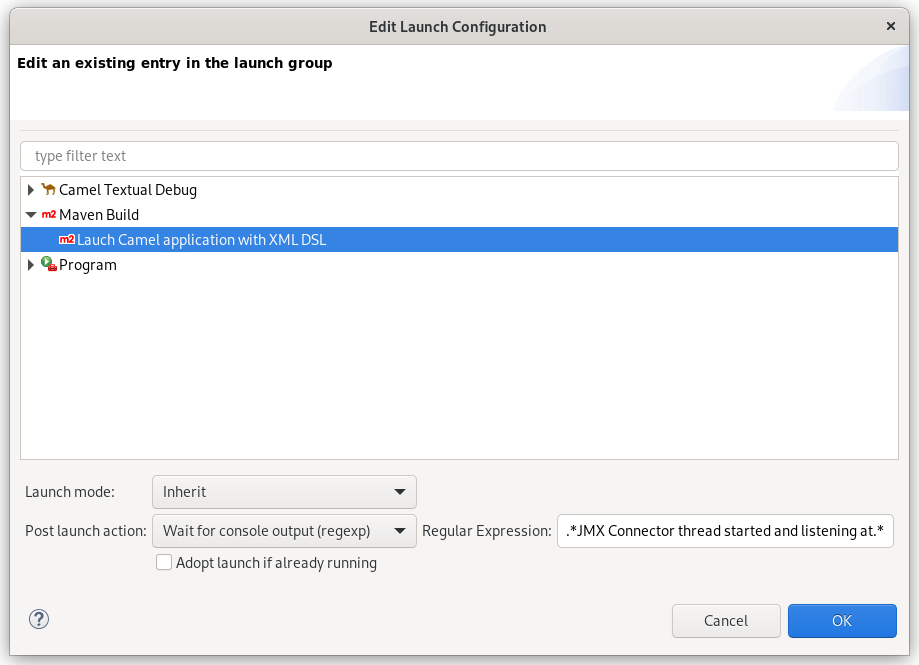
The idea here is to provide a Launch Group configuration which will do both: start the Camel application and attach the Camel debugger. For that, we will combine the 2 previously created launch configurations.
The only trick is for the Maven Build configuration to configure a Post launch action with the regular expression .*JMX Connector thread started and listening at.*. It ensures that the Camel application is ready to accept a Camel debugger connection via JMX before trying to attach.
For the Camel Textual Debug launch configuration, there is no specificity:
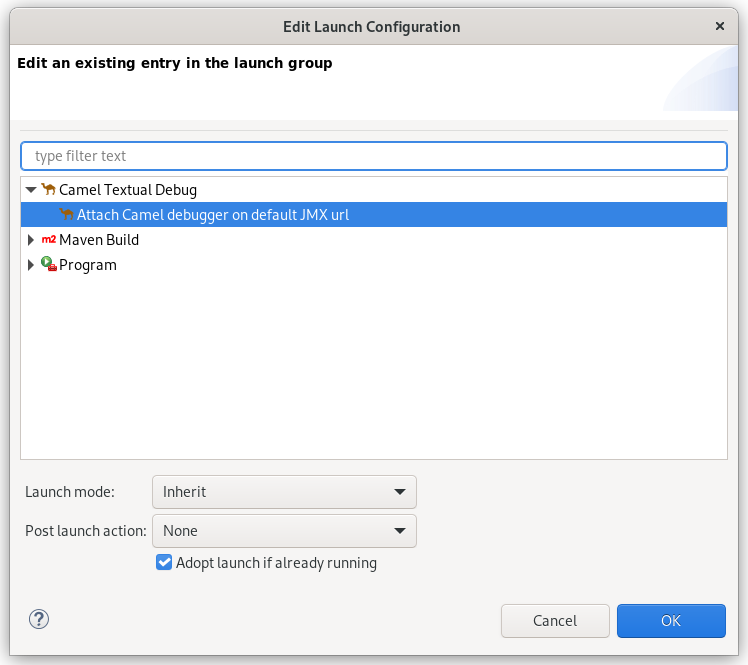
You will end up with this kind of configuration: 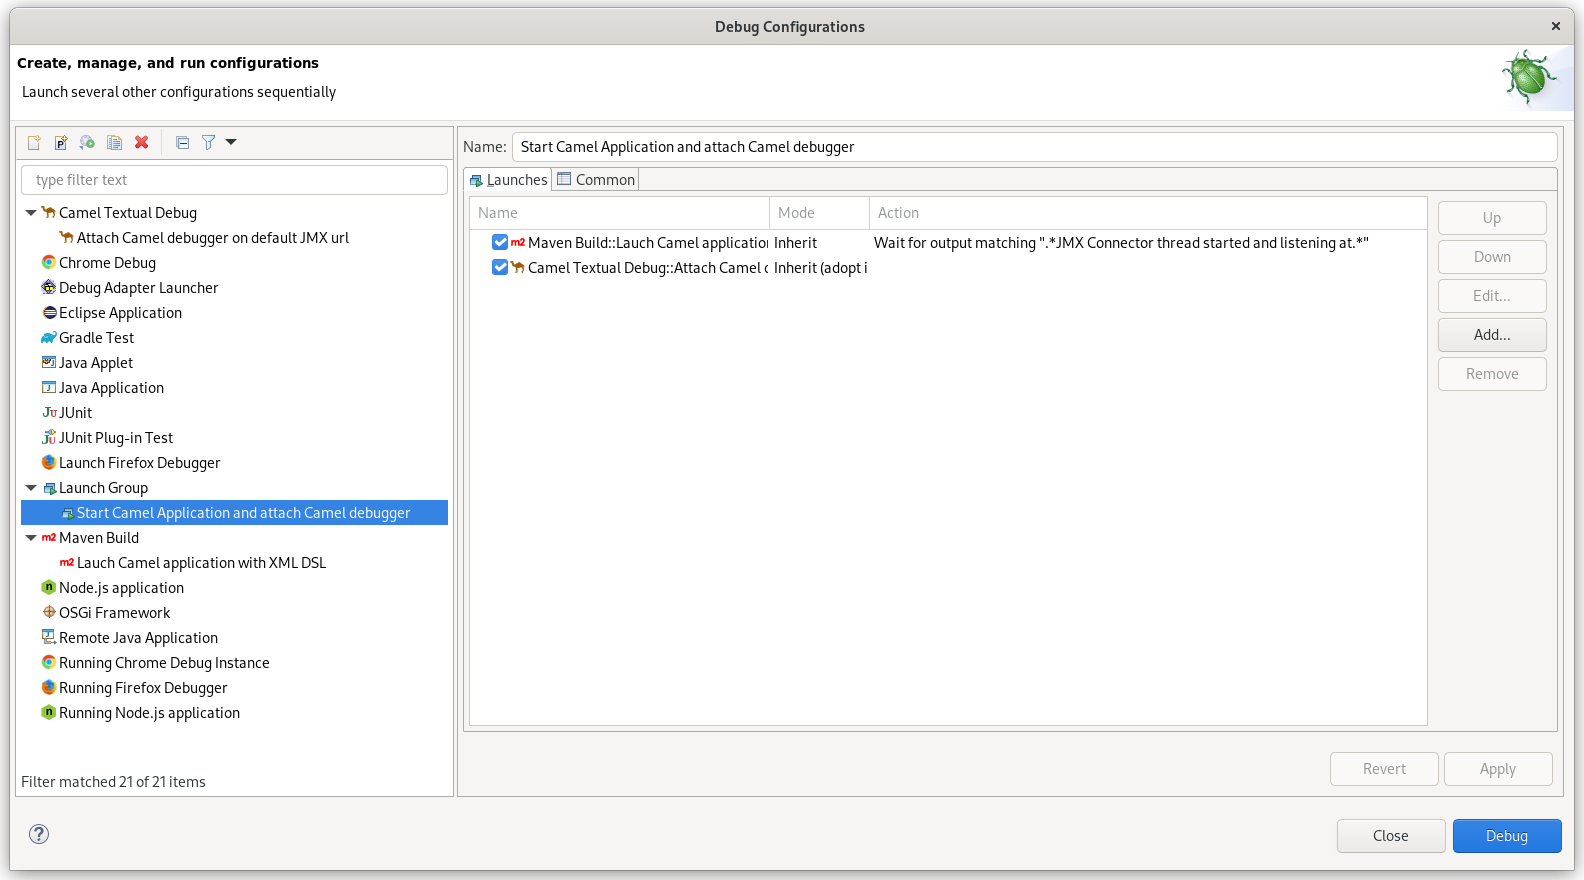
Click on Debug and it will be time to set breakpoints and enjoy!
Resources
Here you can see a branch of the Camel Main example with metadata preconfigured for Eclipse.
I created a short video to see all of that in action here.
What’s next
Next step might be to provide an action to initialize the 3 launch configurations.
You can submit your enhancement requests on the Eclipse client for Debug Adapter for Camel or in the Red Hat Jira.