UPDATED ON 17 May 2021: More recent related content available in this blogpost.
Camel K 1.3.0 is providing a new feature to Java debug deployed integrations. Even if Camel K 1.3.0 is not fully compatible with VS Code Tooling for Apache Camel K extension, it remains possible to leverage the VS Code Java debugging capabilities.
I recorded a video which is following the steps in this blogpost. I let you choose your preferred way to discover how to java debug your Camel K integration in VS Code.
Requirements
- VS Code Extension Pack for Apache Camel
- Uncheck Camelk -> Integrations: Auto-upgrade in File -> Preferences -> Settings -> Extensions -> Apache Camel K Tooling
- Camel K 1.3.0 binary available on command-line
- Camel K deployed to a cluster. In this demo, we will use a Camel K instance deployed on minikube.
How to java debug
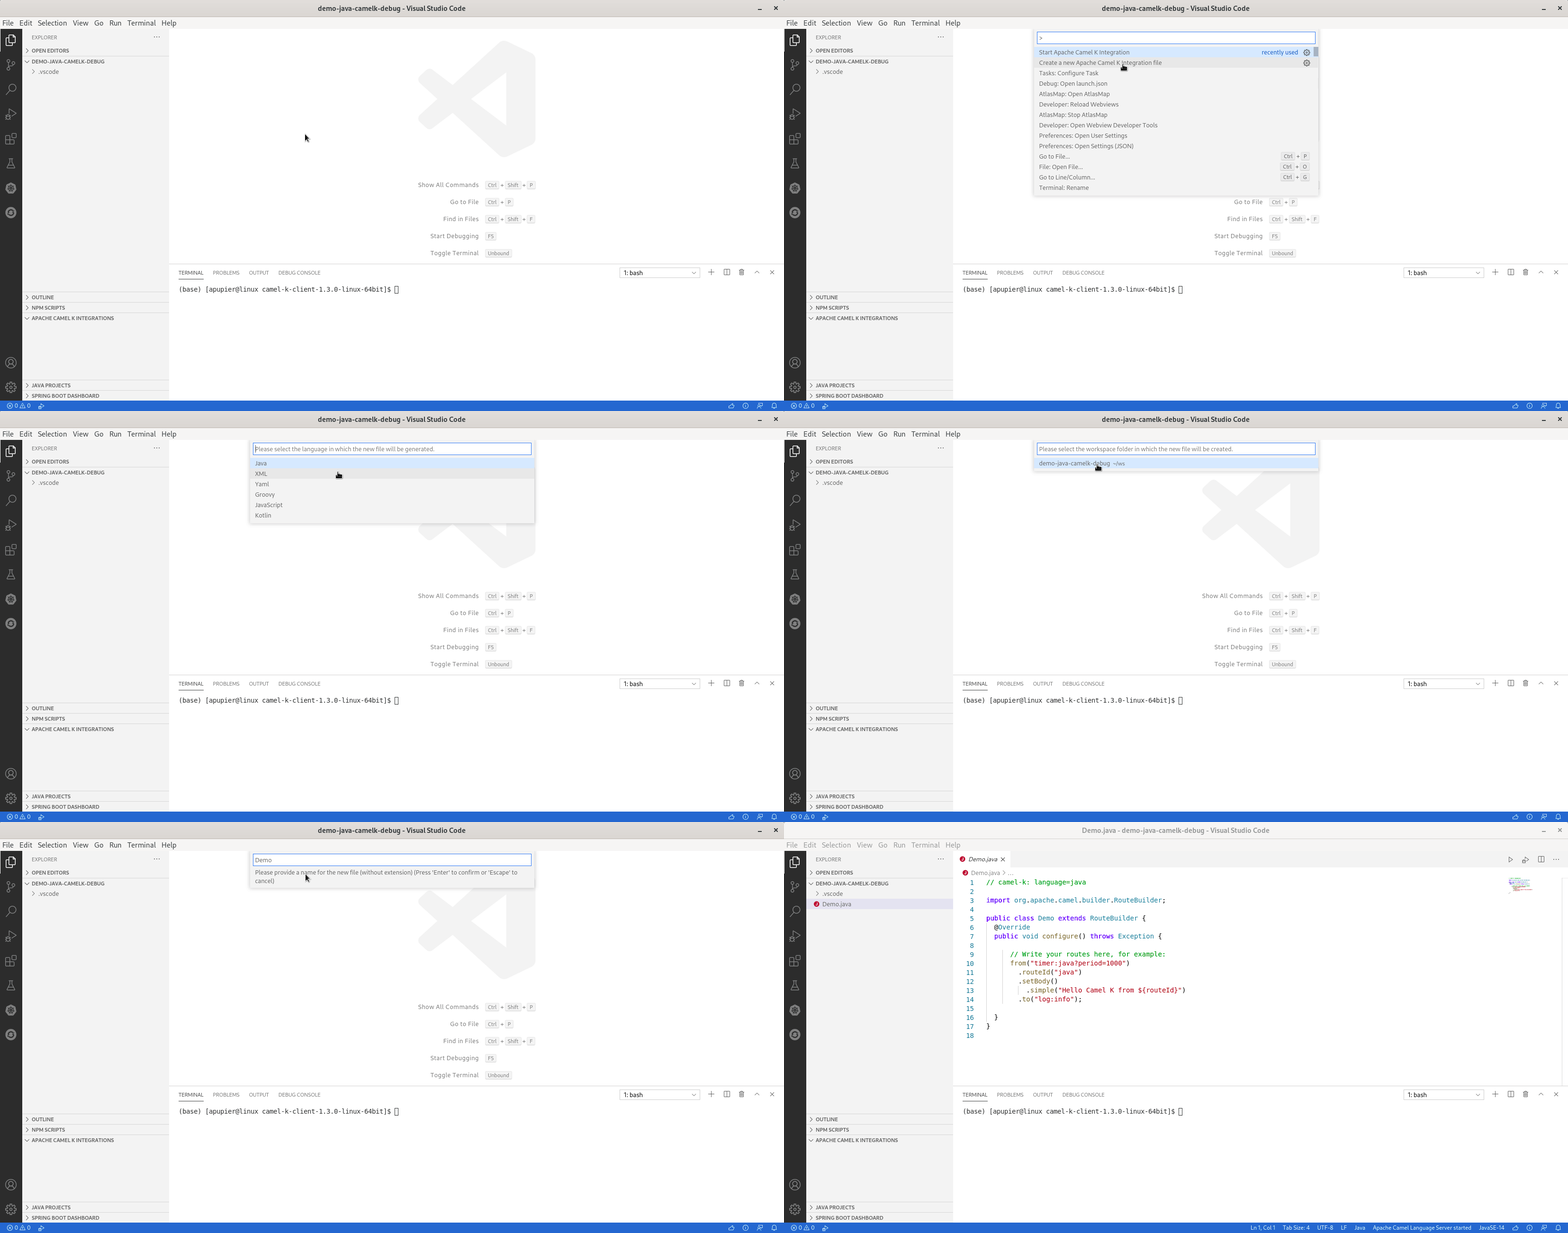
Create an Integration written in Java
- Open command palette View -> Command Palette…
- Select Create a new Apache Camel K integration
- Select Java
- Select the folder
- Provide a name, for instance: Demo
Set a breakpoint
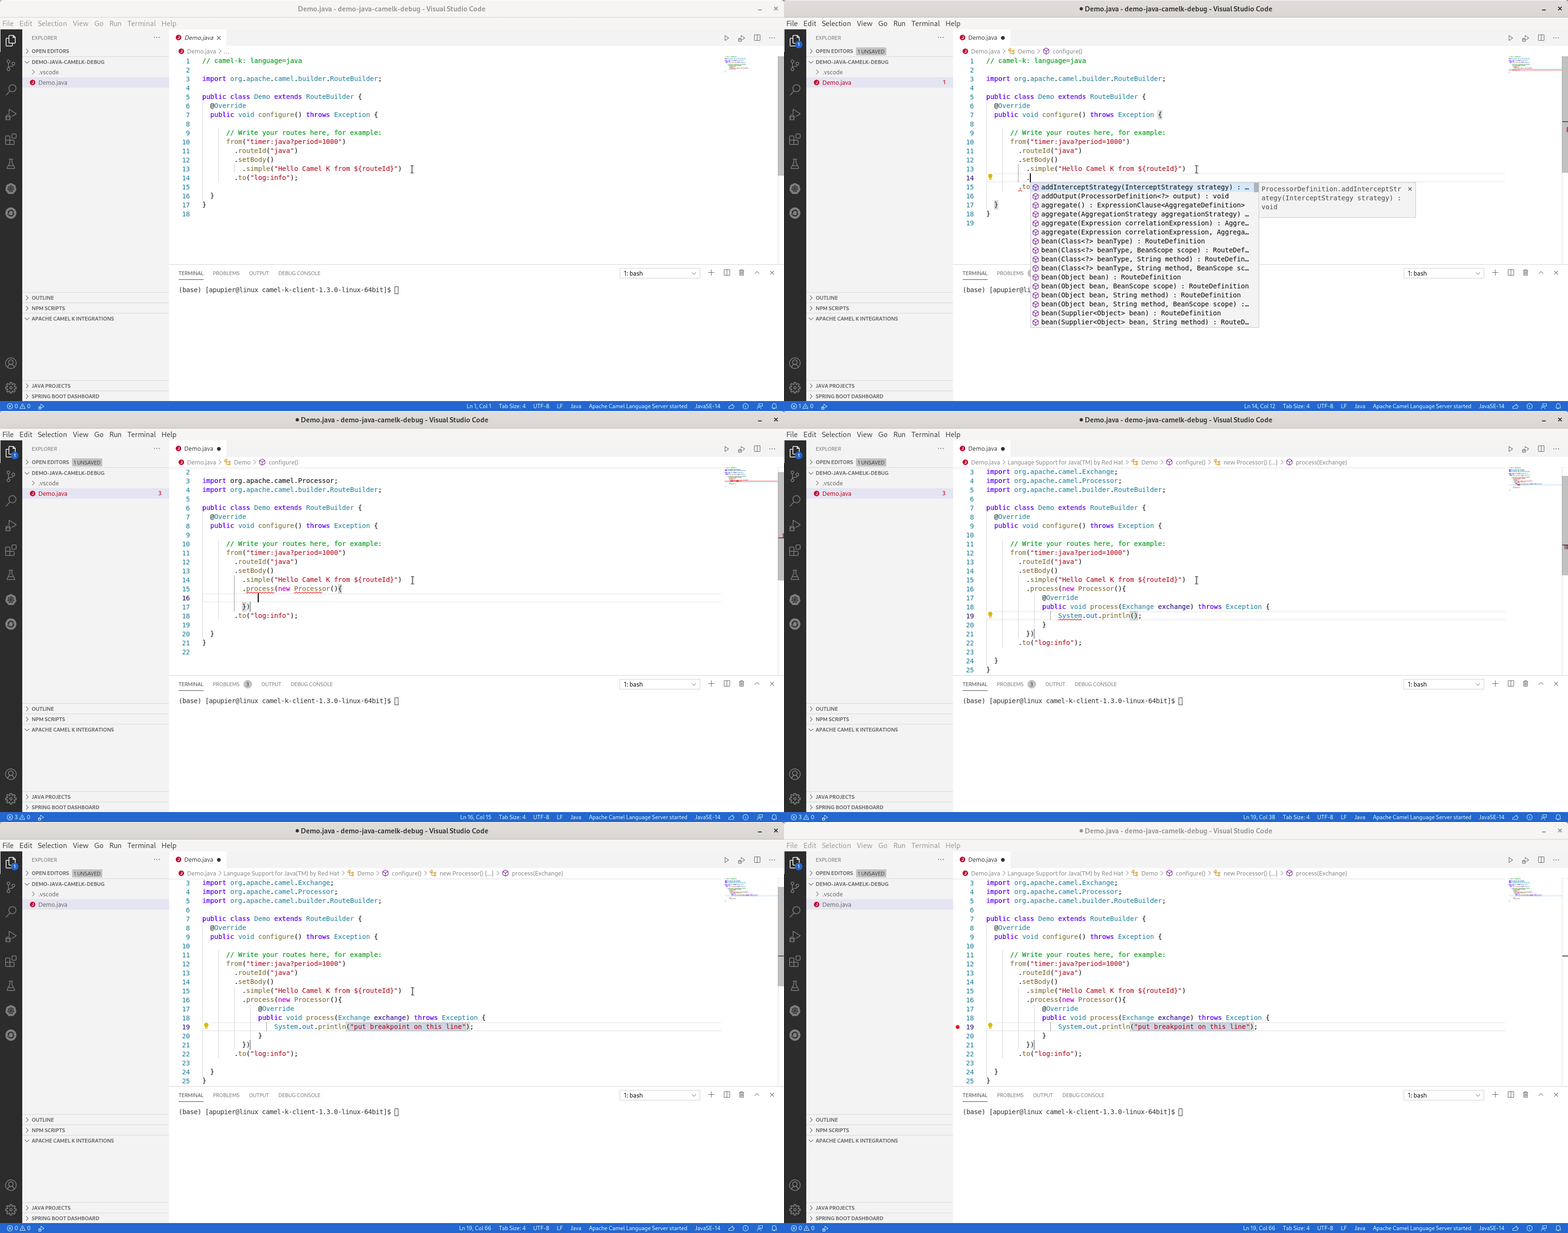
To have a breakpoint during the execution of the Camel Route, as opposite at the creation of the Camel Route, you need to add a small piece of code. This is a classical trick for Java debugging of Camel Routes, not specific to Camel K.
The trick consists of adding a Processor between the steps you want to observe. It will be something like:
	  .process(new Processor(){
		  @Override
		  public void process(Exchange exchange) throws Exception {
			  System.out.println("can be breakpoint on this line");
		  }
	  })
Then, you can add a breakpoint to the line by clicking in the left ruler. A red dot will appear.
Start integration
You can then start the integration:
- Ensure the editor is still opened on the Java Integration file
- Open command palette View -> Command Palette…
- Select Start Apache Camel K Integration
- Select Basic
- Check in the Apache Camel K Integrations view that the example is deployed successfully. it will have a green dot. It can take few minutes for the first deployment.
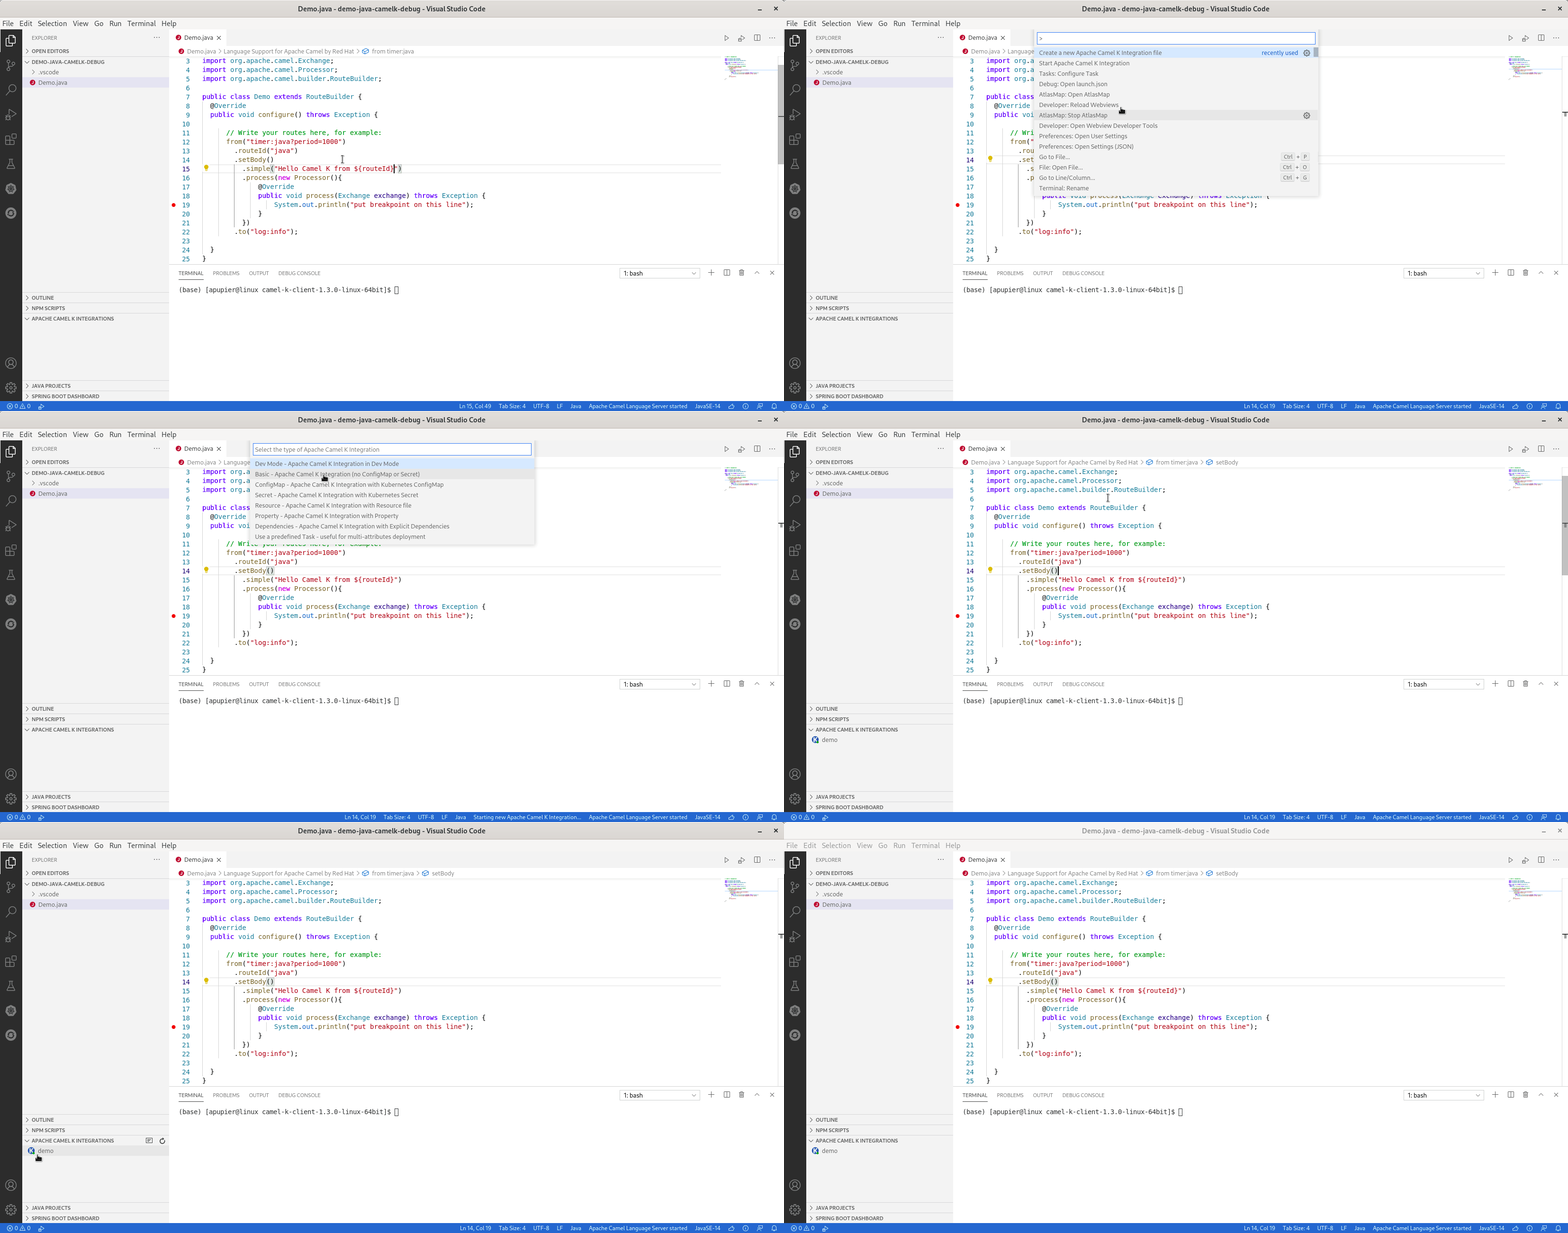
Note: If starting in –dev, it will allow to automatically reload the Integration. But take care, debugger will need to be restarted on each change. Meaning that the next two steps will need to be repeated.
Start debugger on runtime
- Open terminal: terminal -> New Terminal
- Call kamel debug demo (replace demo by the integration name that appears in Apache Camel K Integrations view if you choose a different name.
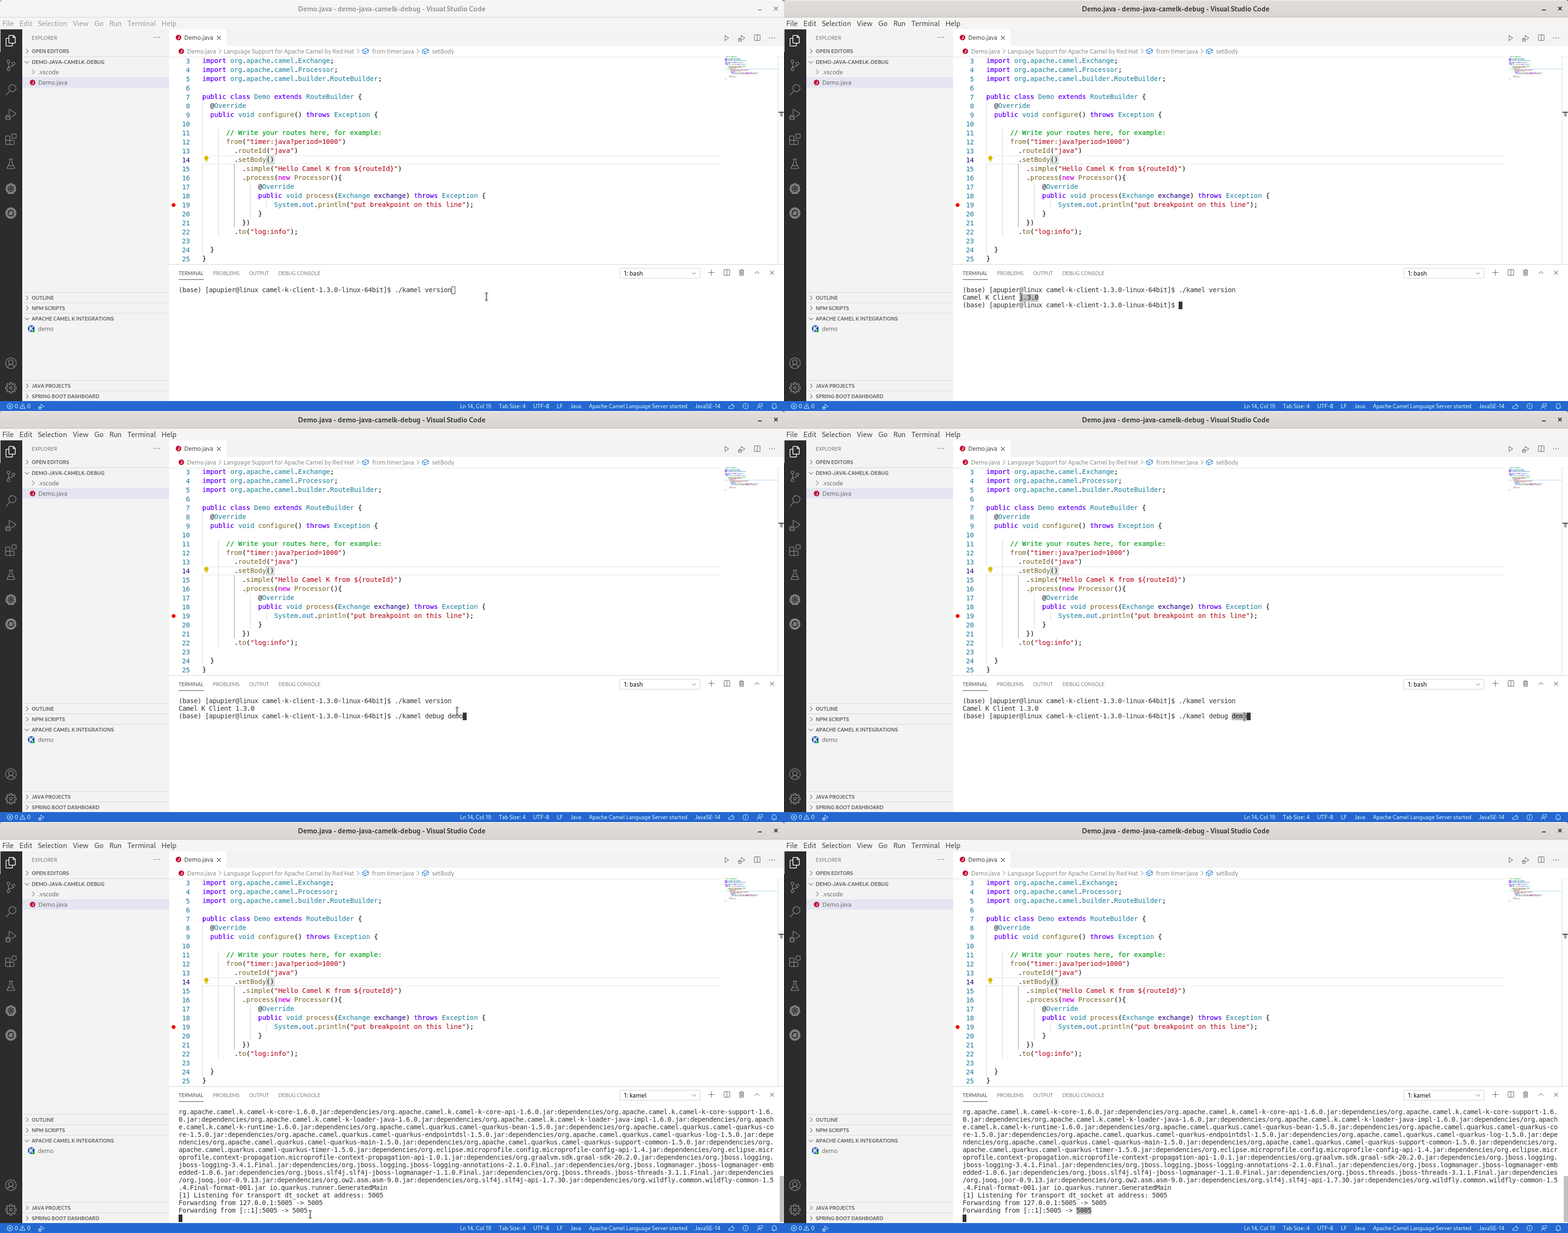
Note: Take care to use the kamel 1.3.0 binaries.
Attach debugger
- In the left panel, select the Run & Debug container
- Click on create a launch.json
- Remove the default configuration
- Use completion to pick the Java: Attach
- Provide a meaningful name
- Update port, by default Camel K is using 5005
- Click on the green triangle to Start debugging
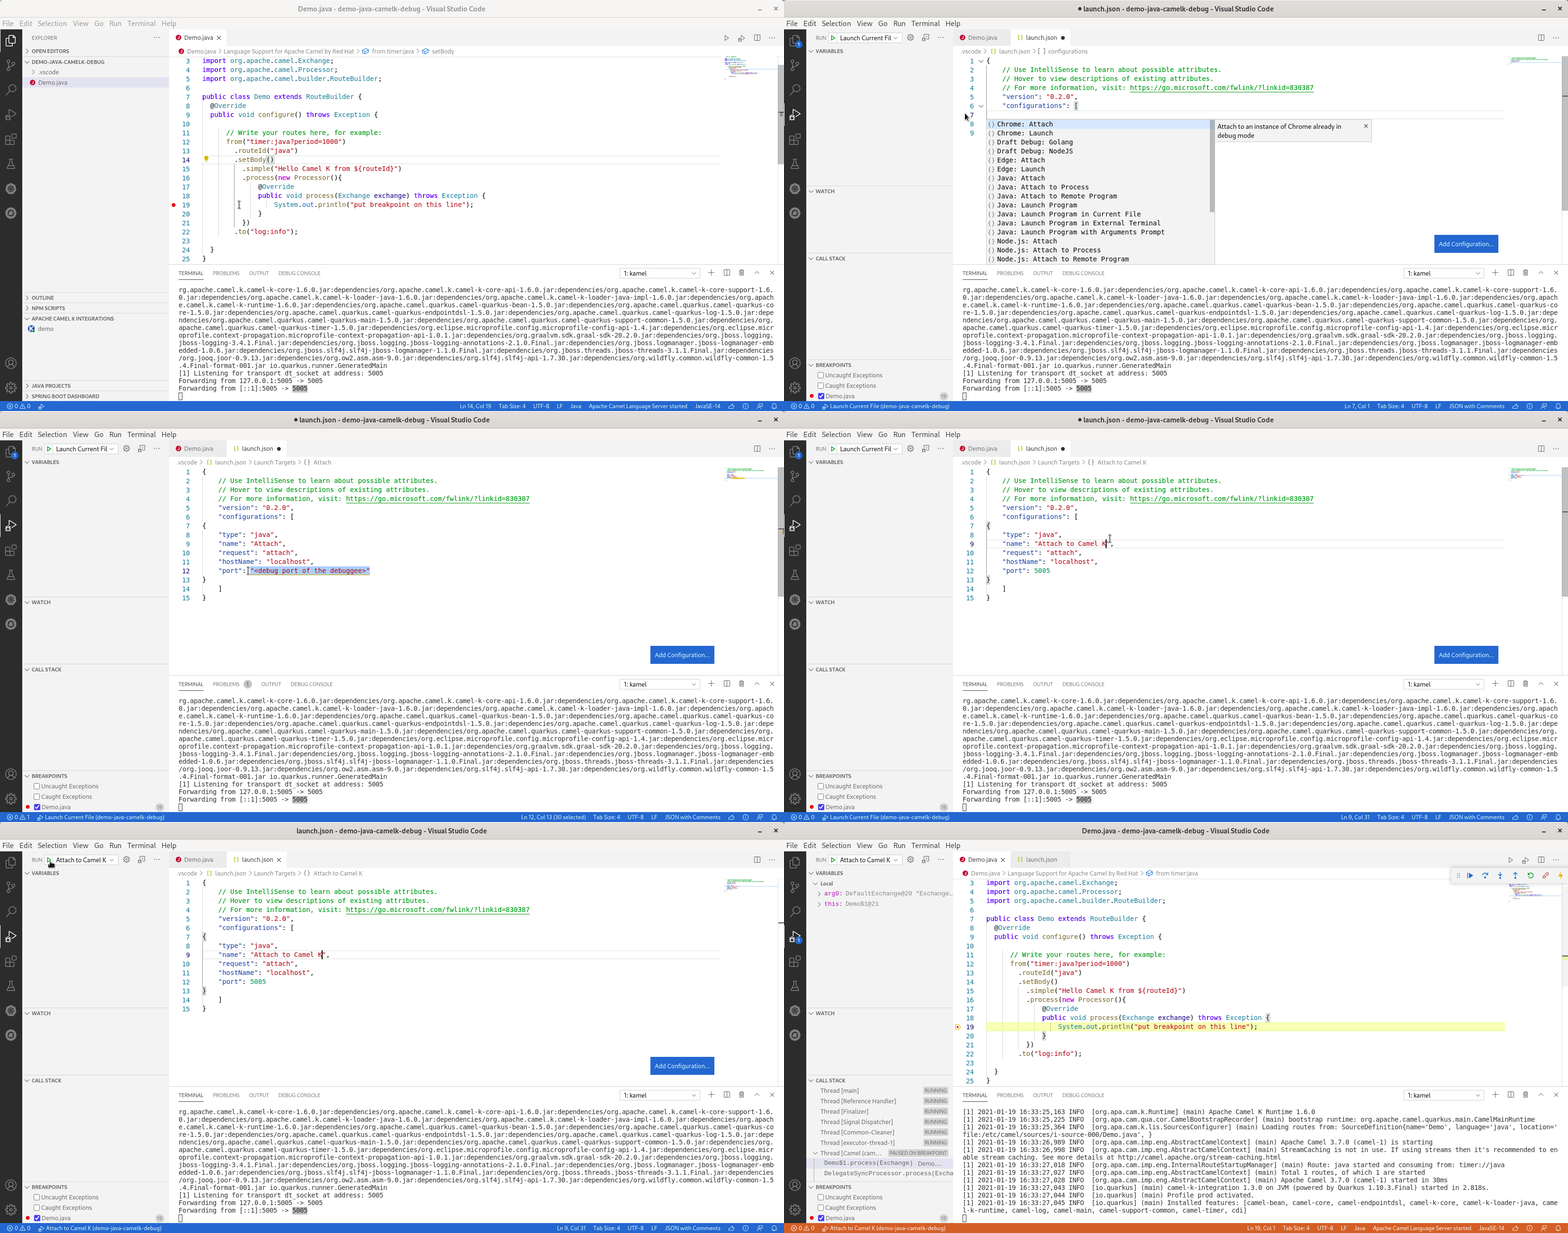
Enjoy
Now, it is time to enjoy. You can notice that you have access to the message content. It is providing a good insight into what is going on in the Camel Route.
What’s next?
There is room for improvements, provide your feedback and ideas!
You can start discussions on Zulip camel-tooling channel.
You can create and vote for issues on GitHub VS Code Tooling support for Apache Camel K repository.
You can create and vote for issues on the related epic in Jira which is used by the Red Hat Integration tooling team.